Month: October 2020


  • Joel Embiid | 2020 Valuation

    Joel Embiid | 2020 Valuation

    (? The Ringer)

    Four years ago, Joel Embiid was on the verge of being labeled a lost cause. Taken with the third overall pick, a prodigy from the prestigious basketball academies of Montverde Academy and the University of Kansas, he missed what would’ve been the first two full seasons of his career with foot injuries. Nowadays, that’s ubiquitously known as a non-issue, seeing as Embiid is in a deadlocked duel for the title as the league’s top center. Do his strong offense and DPOY-potential defense vault him high enough to claim the spot? And what are the percent odds Embiid gives a random team to win a title?

    Scoring

    Joel Embiid quietly remains one of the league’s top scorers. His standard profile of 23.0 points per game and 59.0 TS% don’t pop out as much as Embiid’s true scoring equity does. Due to a mere 29.5 minutes per game and Philadelphia’s -1.3 relative Pace, Embiid was actually closer to a 28 points per game scorer; during the regular season, he averaged 28.4 points per 75 possessions on +2.5 rTS%. In the Playoffs, those numbers expanded to 31.9 points per 75 on +3.9 rTS%. It’s worth noting Boston’s lack of strong interior defenders in that series, but Embiid’s scoring performances were signs of potential superstardom in the postseason.
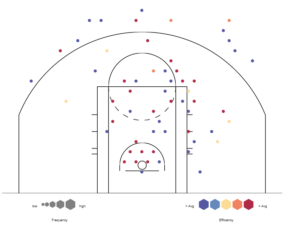
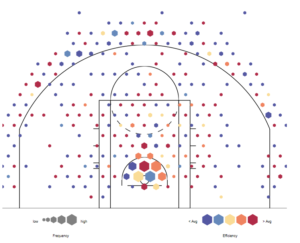
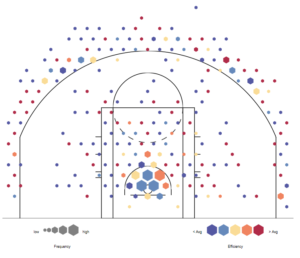
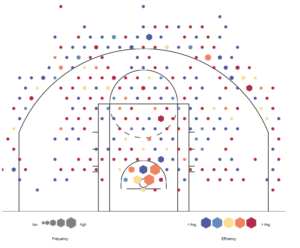
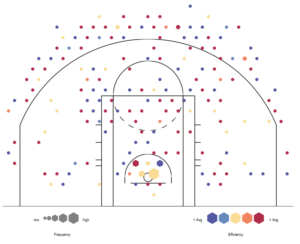
    PBPStats

    Embiid’s shot chart dots the efficiency, frequency, and locations of his shooting spots from this year’s Playoffs. Evidently, his relatively broad points of attack suggest Embiid’s monster scoring in the second season wasn’t merely a result of facing poorer paint defenders. Furthermore, Boston’s strong regular-season defense (-3.6 rDRtg), given Embiid’s shot locations, was likely to limit some of his efficiency and volume, neither of which eventually were. His strong post-game was increasingly strong against the 6’8″, 245-lbs Daniel Theis as well. Embiid went to the free-throw line at an insane rate in that series, posting 15.4 free-throw attempts per 75 and 7.97 free-throw attempts per field-goal attempt. Embiid displayed strong tendencies to draw fouls in the regular season, but took it to a whole new level in the Playoffs.

    It’s no secret that Philadelphia’s star center is less proficient at generating offense outside of the post. Embiid often takes ill-advised fadeaways outside of the painted, a surprising note given his converted on an adequate 41% of mid-range attempts in the regular season. He’s also prone to miss driving lanes, eliminating key opportunities for easy baskets. However, in high-effort stints, Embiid isn’t the lethargic, heavy-footed big man he appears to be at first glance. His balance, considering his size, is an indicator of strong momentum shifting.

    Playmaking

    Embiid’s passing is nothing to marvel over. He seldom shows flashes of proficiency in this facet in the post in which he’ll occasionally make an efficient, well-placed pass to an open interior scorer. However, he’s also prone to misreading handoff opportunities, and with screening action as a focal point of Embiid’s offense, it’s reasonable to suggest his passing hurts Philadelphia more than it helps. Embiid’s Passer Rating, a numerical estimate of passing quality, was in the 34th percentile in 2020. It’s also estimated he’s a negative-impact playmaker, contributing fewer than zero points per 100 in that manner. There are some positive indicators of Embiid’s creation. He opened more than six extra shot opportunities for his teammates every 100 possessions in the regular season; however, it’s also a figure that dipped over three points in the Playoffs. It’s unlikely Embiid will ever strengthen a good offense with his playmaking abilities.

    Off-Ball

    During the possessions in which Embiid isn’t “meaningfully” involved in the 76ers’ offense (~ 55% of possessions), he provides solid off-ball value. As his role as big man implies, a large part of Embiid’s off-ball repertoire is screening action up top. He’s a “dual-threat” screeners in this manner, displaying proficiency in both the interior and on the perimeter. Embiid is a strong pick-and-roll screener with a solid regime running with teammate Ben Simmons. However, Embiid’s off-ball specialty lies closer to the glass. He’s one of the game prominent offensive rebounders, grabbing 10.3% of available opportunities and 3.4 per 75 possessions. It isn’t merely a product of his 7-foot, 280-lbs frame either; Embiid is extremely active on the offensive glass. It’s arguably his strongest point of engagement and one of the areas Embiid thrives in. He’s prone to the occasional flop, wildly exaggerating contact near the basket, but his off-ball value is enough to keep afloat as an interior-specialist center. These qualities wouldn’t fit especially well alongside strong teammates.

    Offensive Summary

    Impact metrics are fairly split on Embiid’s offense. Play-by-play-infused metrics clearly grant the lower end of the stick in terms of offensive impact. For example, Basketball Index‘s PIPM and FiveThirtyEight‘s RAPTOR both denote Embiid’s offense as worth less than 1.1 net points per 100 possessions. However, these results are likely due to some extremities. Philadelphia’s offense improved by +2.6 points per 100 with Embiid off the floor, skewing some of these results. Box score estimates paint a fairer picture of his offense. Basketball-Reference‘s Box Plus/Minus measures Embiid’s offense at +3.7 while my own Box Plus/Minus model estimates that value at +3.4 in the regular season and the Playoffs. Embiid is not an offensive superstar, but his strong scoring is enough to propel him near the top of the pack in the major impact metrics.

    Defense

    Despite a high defensive valuation for Embiid, I’m fairly critical of his team defense. At times, he’s too post-oriented, opting to leave strong perimeter threats open without a paint presence to justify. Although Embiid has that strong frame that we examined earlier, he doesn’t always stay in front of his matchups. He also falls back too immensely on strong-shooting matchups, leaving several open floaters. There are also questions on his focus. Embiid seldom ball-watches, loses players who don’t have the basketball in their hands, and lacks the general defensive attentiveness to maintain consistent off-ball value.

    Conversely, the qualities that make Embiid one of the league’s premier defenders are also apparent. He shows strong passing anticipation; and although he isn’t the strongest and jumping and clogging passing lanes, his reaction time counterbalances some of his slower movements. Embiid is one of the strongest paint presences in the league, having blocked 3.7% of available two-pointers in the regular season and 3.2% in the Playoffs. Paired with a sturdy stature and strong vertical movement, Embiid is one of basketball’s most dominating post defenders. Despite this paint-exclusiveness, Embiid’s value in the Playoffs remains relatively similar. Research done through Thinking Basketball suggests interior-oriented defenders lose large amounts of value in the Playoffs, while Embiid retained nearly all of his (2.3 D-PIPM in the Playoffs).

    Defensive Summary

    Impact metrics regularly view Embiid as one of the game’s strongest overall defenders. Box score estimates are less sensitive to his value due to a declining block rate and a stagnant steal rate; Basketball-Reference estimates his per-100 defensive impact at +1.0, Backpicks argues it’s barely over half a point, and Cryptbeam DBPM clocks that figure in at +1.4. Conversely, plus/minus hybrids value Embiid’s defense significantly higher. His three-year LA-DRAPM is a tick under +5, a clear overstatement compared to his scores in D-RAPTOR (+3.6), D-PIPM (+2.29), and DRPM (+2.00). Embiid’s post tendencies lead me to believe his defensive impact is inflated in pure impact measurements (RAPM), which is still good enough to denote Embiid as a strong All-Defensive level player.

    CPA Valuation

    Joel Embiid would provide a random team an increment of approximately 12.11% odds to win a championship. 


  • A Statistical Guide to 3-Point Proficiency

    A Statistical Guide to 3-Point Proficiency

    (? The Ringer)

    Tony Bradley, Drew Eubanks, and Johnathan Motley. What do these three players have in common? They each made 100% of their three-point attempts last season. Therefore, they must be the league’s best three-point shooters, right? No, of course not. Although the word “best” can have varying connotations here, it’s hardly appropriate to say three players who shot no more than 1.2 threes every 100 possessions were the best three-point shooters of the year. It’s been clear for a long time that conventional three-point percentage is, in essence, not a perfectly-indicative measurement. It pays no attention to the frequency at which a player shoots three-pointers. This has been combated with mental filtering for a while now, but what if there were a method to balance efficiency and volume in three-point shooting and condensed into one number?

    Patrick Miller at Nylon Calculus tried to answer this question, specifically for college basketball players, to predict their three-point percentages in the NBA. His “Bayesian 3P%” was a success, appropriately pinpointing the three-point proficiency of college stars while providing accurate estimations of NBA percentages. Millers’ strong methodology and strong results had me thinking about the applications of Bayesian statistics in the NBA, and how they could improve the traditional measurement of three-point percentage, the result being a “prior-informed” three-point percentage or PI 3P%.

    Methodology

    As stated earlier, the goal of PI 3P% was to find a balance between efficiency and volume from beyond the arc to create an “adjusted” three-point percentage that accounts for a player’s shooting volume from that range. I retained the essence of Bayesian statistics in PI 3P% with the use of priors: previous beliefs on a subject used to improve the raw data, ours being three-point percentage. To do this, I regressed (logarithmically) the last twenty-five seasons of three-point attempts onto three-point percentage to provide a foundation for the prior; thus, accounting for diminishing returns on higher frequencies under the impression that three-point percentage becomes more and more indicative as a player takes more and more shots. All data in the regression were adjusted to “per-100.”

    With the prior, I was able to estimate a player’s three-point percentage based on how often he shot from that range. The next step was to merge a player’s actual percentage with his expected percentage, but I also had to decide to how great a degree the latter would be weighed. This process was simply a lengthy test of observing how percentages change with different weightings and comparing residuals against three-point attempts. If the weighting was a success, then the residuals should decrease as attempts increase (below). 

    From a sample of last year’s data, we can see there’s a typical decrease in adjustments as a player’s frequency from three-point range increases. The prior serves the purpose of negating extremely-high percentages on low volume but also reduces the effects of anomalous results. Dusty Hannahs of the Memphis Grizzlies converted on 67% of his 10.8 three-point attempts per 100 possessions, a mark that lowers to a 46% prior-informed three-point percentage. This is an extreme instance, of course. Players’ updated three-point percentages will continue to represent great-shooting seasons with minor luck adjustments. That being said, adjusting for luck does not extend to playing time. Hannahs, the league’s leader in prior-informed 3P% last year, played a mere 13 minutes the entire year. PI 3P% is a descriptive statistic to measure a player’s three-point proficiency during his time on the court. 

    With our prior-informed 3P% up and running, can we still reasonably state the original trio of Tony Bradley, Drew Eubanks, and Johnathan Motley represents the league’s best distance shooters? This model strongly disagrees, with no player of the group posting a new percentage higher than 28%. Instead, we can select a new group of players in place of them. For players who were on the court for at least 1500 minutes last season, the top shooters in PI 3P% are:

    1. Duncan Robinson
    2. J.J. Redick
    3. Dāvis Bertāns
    4. Buddy Hield
    5. Seth Curry

    This group is far more representative of the league’s top distance scorers, each of them having shot at least 9.8 attempts per 100 with an efficiency of at least 39%. Meanwhile, Tony Bradley, the sole member of our original trio to make the Playoffs, fell to 0% in the second season. With a prior-informed three-point percentage, we can reduce the need for mental filtering in determining the league’s best three-point shooters.

    The database for PI 3P% can be found here.


  • Jrue Holiday | 2020 Valuation

    Jrue Holiday | 2020 Valuation

    (? The Ringer)

    Is it fair to say New Orleans’s Jrue Holiday is underrated at this point? He’s had several instances of strong recognition in his career, including an All-Star appearance and two All-Defensive Teams, as well as praise following his twenty points per game season last year and a great display of defense against Damian Lillard in the 2018 Playoffs. However, question marks have been raised about the validity of his impact. Holiday’s luck-adjusted RAPM in the last three years has been higher than all but one player in the NBA. The dichotomy of his lesser forms of recognition versus supposed impact led me to set out to answer an important question surrounding his true value: what are the percent odds Jrue Holiday provides a random team to win a title?

    Scoring

    Holiday’s scoring is one of the strongest indicators of his role: the offensive engine of a moderate offense. Although he plays the shooting guard position, Holiday acts like a point guard in the Pelicans’ offense. He’ll often receive the rock at the perimeter, specializing in either the wings or up top. Holiday typically attacks the basket with very slow drives. He sizes up the defense instead of immediately penetrating to the rim, and this action spurs ball movement on the perimeter and improves New Orleans’s playmaking, as we’ll examine later on. Holiday is exempt from his less pressurized drives by his agility near the hoop. He’s neither particularly explosive nor quick, but his ability to maneuver his hips and sides creates several shots in the paint. However, Holiday converts on a mere 59% of attempts at the rim with his lowest efficiency from within three feet of the rim in three years.

    Particularly unique to him in a group of elite NBA players, Holiday rapidly declined in scoring efficiency from last season. He surged in the category from the 2017 to 2018 seasons, posting a +1.4 rTS%, a +3.5% increment from the previous season. The season afterward, Holiday was just below league-average at -0.2%. During 2020, that figure dropped to -2.4%. What created this mostly unforeseen deterioration in scoring efficiency? If we look at his shooting locations in each of the past two seasons, a clear trend emerges that may explain some of Holiday’s shooting deficiencies.

    2018-19 season

    2019-20 season

    Provided by PBPStats, there are two clear distinctions between the two charts: Holiday’s lack of efficiency in the paint and mid-range attempts in the 2020 season. Perhaps there is a “poor-luck” nature to his woes in the post; Holiday’s efficiency from within three feet of the hoop is the lowest it’s been in the last three seasons. However, considering Holiday’s efficiency in that range this year would surpass each of his marks from his first eight seasons, it’s safer to refrain from a “poor-luck” perspective. Rather, it’s more likely Holiday’s efficiency is stabilizing after two anomalous seasons in the paint. Due to his subpar efficiency and volume that doesn’t compensate for the missed opportunities for his shots, I wouldn’t recognize Holiday as a “good” scorer in the NBA, but his attributes in this facet contribute toward a larger range of team offense.

    Playmaking

    Holiday’s ability to engineer an offensive is done through his creation and passing rather than his scoring. His aforementioned tendency to start with slow drives toward the paint often spurs the action of the Pelicans’ offense. When Holiday positions himself near an elbow, just outside the paint, his presence is enough to draw defenders from the perimeter inward, as if the middle of the paint is the center of a gravitational force acting against opposing defenders. Holiday’s creation is largely due to his ability to unclog the corners, two spots at which New Orleans frequently positions shooters to take advantage of Holiday’s strengths. His constant ability to carry out this series of events makes up a large portion of his offensive value and points toward his contributions as a creator.

    Although he’s not the highest-quality passer in the world, Holiday is still capable of hitting tougher spots in pressurized situations. New Orleans’s passing on the perimeter is among the league’s best, and Holiday’s creation is the initial force behind it. If it weren’t for Holiday’s selective creation, his offensive value would be far lesser. It was enough to grant him a Passer Rating upward of seven on the one-to-ten scale, continuing his statistical trend of high-quality passing. Holiday’s playmaking was worth almost three-quarters of a point per 100 according to Backpicks‘s “PlayVal,” but I think that measurement undermines his capabilities as an offensive funnel through his creation and passing. Due to Holiday’s declogging and perimeter action, I’d denote him as a “very good” playmaker in 2020.

    Off-Ball

    Holiday’s value off the ball is almost exclusive to the perimeter. Given his role as more of a point guard to the Pelicans, he’s frequently required up top to initiate facilitation or score in the post. Resultantly, it’s uncommon to see a consistent string of possessions in which Holiday makes a significant impression in the paint without the rock in his hands. Although his preference of the arc may seem a deficiency at first glance, Holiday provides a number of positives on this front. Despite his 6’3″, 205-pound frame, he’s an effective screener on the perimeter, and similarly a proficient pick-and-roll screener. Holiday plays an extremely active role up top. During conservation situations, he’ll plant himself at a corner, a schematic New Orleans’s offense displayed throughout the season. Holiday’s adequacy as a shooter (35.3% from 3) makes him a great option for the Pelicans in these spots. He may not provide the distinct value of a Stephen Curry or Reggie Miller, but Holiday’s off-ball value is of use to a multitude of offenses.

    Defense

    Holiday’s case as one of the league’s top guards relies on his defense. He plays a low-risk style of defense that minimizes errors. Holiday’s most frequent mishaps, missing deep cutters and flat-footedness in transition plays, are very rare occurrences on the court. His far more prevalent strengths are prominent either on or off the ball. When he’s directly guarding a matchup, Holiday has some of the strongest positionings of any guard in the league. His strong mix of upward and downward stances to match the angle of his opponents cause some of the strongest commotions a 6’3″ guard could do. Holiday consistently staggers offensive sets, denying penetration attempts additionally with his great hands. This is largely in part due to an optimized armlength radius, keeping opponents far enough at bay to prevent foul trouble but close enough to prevent easy drives. As evident from his 1.7 steals per 75 possessions, his pickpocketing capabilities are near the top of the league. Paired with strong defensive coverage, especially on the perimeter and in recovery, Holiday is one of the very best defensive guards in the NBA today.

    Summary

    Impact metrics have a large variance but a stable typical picture of Holiday’s value. His aforementioned luck-adjusted RAPM was second in the entire league. Holiday’s minimum comes from Goldstein’s PIPM at +1.73 per 100 possessions. With an offensive impact typically ranging from 1.5 to 2 points and a defensive impact usually worth 0.5 to 1 point per 100, Holiday’s situational value is mostly stable aside from his RAPM-esque outliers. Play-by-play data certainly paints a greater picture of his value than the box score, and pure situational value argues he’s among the league’s best. However, due to his declining RAPM (+1.4 in 2020), it’s likely a three-year sample is too partial to earlier events. Based on evaluations of Holiday’s offensive and defensive values, I’d denote him as an “All-Star level” player in 2020 and estimate Jrue Holiday provides a random team with 7.7% odds to win a title at full health. 


  • Jamal Murray | 2020 Valuation

    Jamal Murray | 2020 Valuation

    (? The Ringer)

    Jamal Murray was already showing strong signs of improvement coming into the bubble. He’d taken on an increased load, with notable increments in usage rate and offensive load. More importantly, Murray had started doing more in his time on the court. However, the Playoffs painted a new, renowned picture of Murray’s potential. He exploded in the postseason, with drastic improvements in scoring volume, efficiency, creation, and offensive rebounding. Murray’s stellar performance in the second season left questions as to whether the stint was merely a fluke or an indicator of seasons to come. I’ll attempt to provide an answer to the questions surrounding Murray’s game and determine the overarching principle of my player valuations: what are the percent odds Jamal Murray provides a random team to win a title?

    Scoring

    Murray’s scoring is largely built around his role as an on-ball driver. For the first time in his career, his usage rate exceeded 25% and his offensive load has exceeded 40%. Murray functions well up top as Denver’s primary pick-and-roll ball-handler, a tandem he enacts with teammate Nikola Jokić as one of the most effective routines in the team’s offense. Murray will use these opportunities to search for shot opportunities at the perimeter or in the mid-range. His highly-effective step-back move is one of the driving points of his superb mid-range scoring; Murray converted on 46% of his 7.4 attempts per 75 from that range. In the Playoffs, he continued this strength and used it to punish the Lakers’ strong defense. Murray improved from every single one of Basketball-Reference‘s primary shooting ranges from the previous season, an indicator of his growing efficiency.

    Interestingly, Murray has had an up-and-down track record with scoring efficiency. His True Shooting percentage has been below league-average in three of his four seasons, with the exception in his sophomore year: a product of improved efficiency from two and three-point ranges. In 2020, that mark was a -1.1 rTS%. Murray was the most efficient from inside the arc as he’d been in his career, but subpar distance shooting (34.6% from 3) saw a dip in overall efficiency. However, Murray’s efficiency took an unprecedented leap in the Playoffs, coming in at +6.7% greater than league-average, despite facing three tough defenses in the Clippers, Jazz, and Lakers. If we examine Murray’s shot charts from the regular and postseasons, there are identifiable trends.

    Regular Season

    Playoffs

    Provided by PBPStats, we can see the diversity of Murray’s shot locations decreased from the regular season to the postseason. It can either be attributed to 1) fewer opportunities to expand his locations or 2) a higher dependency on the two most efficient ranges: the perimeter and the paint. There’s a clear decrease in mid-range frequency, especially near the corners. Murray’s mid-range proficiency allowed for less hesitance closer to the free-throw line, but his heavier reliance from three (where he shot 45%) and the rim (where he shot 66%) created drastic changes in his efficiency and volume. For reference, Murray had a ScoreVal (an estimate of points per 100 from scoring) below zero. In the Playoffs, that figure nearly reached 1.5 points, the tenth-highest score in the second season. Murray’s regular-season volume and postseason scoring will likely propel him to All-Star status, but his regular-season efficiency will play a large role in the future of his career. My recommendation: prioritize the ranges he excelled in during the Playoffs, the paint and the perimeter, and cut down on mid-rangers near the corners.

    Playmaking

    Murray is also one of the league’s better passers and playmakers. During the regular season, he showed promising results on that end with solid transition play and the ability to open up the corners: two prominent spurs of Denver’s offense. The only true knock against Murray’s regular-season passing was a slight lack of recognition in certain plays. There were spots in which he was positioned to split the defense with a bounce pass to a roller, yet Murray would refrain. All things considered, he was a very good playmaker in the regular season, creating around eight shots for teammates every 100 possessions with a Passer Rating eclipsing the six-mark. Murray’s postseason playmaking, however, reached an elite level. Although his Passer Rating was identical to his regular-season mark, the figure doesn’t do justice to how good Murray’s passing was in the second season. This more engaged version of Murray was a near-elite playmaker, creating upward of twelve extra shots every 100 and converting on extremely difficult attempts.

    His regular-season playmaking was summed up in his PlayVal, an estimate of points added per 100 from playmaking, which came it over half a point. Already a good mark for Murray, similar to his scoring, his postseason playmaking became elite. Instead, he was contributing nearly 1.5 points every 100, which, similar to his Playoff ScoreVal, was one of the best scores in the entire league. Here, an old question arises: was this postseason jump a fluke? I’d hesitate to say it was; Murray’s passing was certainly better, but it seemed more a product of engagement rather than a lucky burst. His creation doesn’t receive the exact same treatment; some of his proficiency was aided by strong scoring, which is more likely a product of luck. However, it isn’t unreasonable to state Murray is a good, or even very good, playmaker in 2020.

    Off-Ball

    Similar to the league’s group of on-ball guards, Murray doesn’t provide a whole lot of value without the ball in his hands. This isn’t to say he goes so far as to idle on the perimeter like James Harden. Rather, Murray anticipates regaining the ball in these spots. He’ll often run the ball down the court, after which he’ll snap a quick pass to a teammate on the perimeter and come down near a corner. If Murray doesn’t try any screening action to open a teammate up near the top of the perimeter, he’ll often run a back-and-forth route back up top to get the rock. Murray targets potential screeners on the perimeter for handoffs and a quick path to attack the basket. He’ll rarely find himself camping out in the post, but an elbow isn’t uncommon. These deeper plantings allow for teammates to screen against Murray’s defender, open up Murray, and get him back up top to run some more offensive action. Denver has a great system built around Murray’s lack of elite off-ball value, allowing him to emphasize his strengths and contribute the most he can to the scoreboard when the ball isn’t in his hands.

    Defense

    Murray is a 6’4″ guard with a 6’6″ wingspan, so without the face value physical traits, his defense would come across as underwhelming. However, the value he brings on the defensive end doesn’t seem to hurt Denver’s defense at all; in fact, it may even help slightly. Murray’s defense has minorly fluctuated over the length of the season, but the aggregate of all his efforts paints a good picture of his defensive capabilities. For example, he shows good hands and hand placement, often finding smart steals opportunities in slowed fastbreak plays. Murray stole the ball 1.3 times every 75 possessions in the regular season. He also has surprisingly strong positioning. Against strong centers like Joel Embiid, Murray was able to keep his matchups in front with planted feet and an upright stance. He’s also a good switch defender, making more automatic rotations than a typical guard. Murray recognizes the need for perimeter coverage as well, and doesn’t fall under the typical umbrella of guards leaving at least one perimeter threat open. I’d argue Murray is a neutral-impact defender in 2020.

    Summary

    Impact metrics are fairly indicative of Murray’s true value. His offense is typically valued at around two net points per 100 in the regular season, and even higher in the Playoffs. I wouldn’t argue with these scores too much, although Murray’s role as an on-ball talent leads me to believe he wouldn’t experience lesser diminishing returns alongside greater teammates. His defensive scores are also relatively stable. It’s mostly evaluated as neutral in impact, with anomalous scores from metrics like RPM (+1.31 DRPM). It’s worth noting RPM grants Murray a score of -0.39 on offense, without a doubt a large question mark. However, his impact is appropriately represented through impact metrics. I’d estimate Jamal Murray provides a random team with 6.86% odds to win a title at full health.


  • Klay Thompson | 2019 Valuation

    Klay Thompson | 2019 Valuation

    (? The Ringer)

    Praised for his two-way play and world-class marksmanship, Klay Thompson was often drowned out in a sea of offensive stars in Golden State. Despite five consecutive All-Star appearances, he was the Warriors’ third option on offense. Thompson’s status as a tertiary offensive weapon hindered the recognition he would receive, but the development of title odds metrics have demonstrated the importance of second-and-third stars. Today, I’ll tackle questions like the true value of Thompson’s offense and defense to estimate the overarching principle of my player evaluations: what are the percent odds Klay Thompson wins a title on a random team?

    Scoring

    Despite a limited involvement in Golden State’s offense (offensive load ~ 33%), Thompson was one of the league’s most effective scorers. He provided strong options in the three main regions of scoring: the post, the midrange, and the perimeter. Thompson was successful on 72% of his attempts from within three feet of the hoop and didn’t shoot lower than 42% from any of Basketball-Reference‘s primary shooting ranges. He had a moderate dip in three-point efficiency compared to his previous seasons: 40.2% in 2019 down from 44% the season before, the main factor in Thompson’s declined overall efficiency (-2.8 rTS% from 2018). However, this was mainly a product of early-season struggles; Thompson raised his three-point efficiency to 44% in the Playoffs.

    As the lethal shooter he is, Thompson thrives on step-back opportunities. He doesn’t maneuver the way most elite step-back shooters do, like Luka Dončić or James Harden. Thompson’s movement is largely directed from one baseline to the other, a vertical motion rather than horizontal. He’ll often be running toward the hoop with the ball in his hands and quickly shift his momentum backward, snapping a shot multiple feet behind his defender. This unorthodox path of movement also makes Thompson a great driver. Aided by his 6’7″ frame, exceptional for a guard, Thompson is a solid post-up option to keep up with larger wings. Although a hesitant dribbler at times, Thompson would function as an adequate secondary or tertiary pick-and-roll ball-handler. His ability to exploit a defense’s horizontal spacing, the spacing between two staggered defenders, opens up the corners for shooters and either side as a driving lane for the roller.

    Thompson was one of the league’s greatest tertiary scorers in the league, averaging 22.6 points per 75 possessions on +1.4 relative True Shooting. The latter measurement is not the most indicative figure of Thompson’s efficiency as we examined earlier. In the Playoffs, he rose to +1.9% in the efficiency department, still an underwhelming figure. However, considering his two-point efficiency dropped 5.4% in the Playoffs, it’s clear there are some confounding variables working against Thompson here. At an average strength, let alone full-strength, Thompson is still one of the league’s most efficient shooters and scorers. According to Backpicks‘s ScoreVal metric, Thompson’s scoring added fewer than 0.5 points every 100 possessions. However, considering his aforementioned efficiency troubles, his actual value would most likely exceed that benchmark. Thompson’s high-volume, high-efficiency style paired with historical shooting makes him an elite scoring option in Golden State’s offense.

    Playmaking

    Thompson never has, and likely never will be an above-average creator and passer. His limitations are very clear, especially in the half-court. Thompson will pick up his dribble and be forced to make a close pass near a block, and in those spots, he displays some concerning accuracy. We’ve seen this during the entirety of the 2019 season: Thompson struggling to generate efficiency half-court offense with his passing. Throughout his career, Thompson has never had a Passer Rating less than 4.2 or greater than 5.1, perhaps a mild overstatement, but the measurement largely captures the quality of his passing. Thompson is also an unimpressive creator. Defenders would often leave Thompson often despite his presence on the perimeter. However, it’s fairly clear and worth noting that those defenses had more trouble than usual: Curry and Durant. As a result, I’m willing to state Thompson’s “true” creation is understated by his situation. He’s created around 4 to 4.5 shots per 100 in the last four seasons.

    As a member of the Warriors, Thompson has provided neutral to slight-negative value as a playmaker. Backpicks‘s PlayVal estimates Thompson’s point-contribution as a playmaker has been below zero since the 2016 season. However, as we examined earlier, this is in large part a product of Thompson’s situation. If he were in a neutral setting, Thompson would likely be neutral to a slight-positive playmaker. The quality of his passing, a characteristic that isn’t affected by situation, hinders Thompson from “good” playmaking status. His creation would likely improve alongside more typical teammates with an increased role as a ball-handler and a larger threat to defenses, and as a result, I’d label Thompson as a “neutral” playmaker in 2019.

    Off-Ball

    Similar to his two previous skills, Thompson’s off-ball value is overshadowed by the likes of teammate, Stephen Curry: one of the greatest off-ball scorers of all-time. Thompson displays his own fair share of calculating movement. Contrary to Curry’s arsenal of screening action and quick darts across the court, Thompson relies on his lateral movement. His strong hips that aid him as a man defender allow him to quickly change direction and faze defenders. Resultantly, Thompson will often find himself an open look at the perimeter, where his more enveloped role in Golden State will provide Thompson with an open shot. He also separates himself from Curry with his off-ball value in the post. Thompson is far more likely to be seen camping out by or cutting through the baseline, locating post-up opportunities, and funneling through as an offensive rebounding option. Thompson’s value off the ball adds to his elite scalability and impact as an offensive player.

    Defense

    Thompson fills a much-needed role in Golden State as the defender of the opposing team’s best offensive perimeter player. His aforementioned size plays a key role in Thompson’s containment of the league’s premier offensive stars. He’ll often match drivers in a running motion rather than a display of lateral movement, as we saw in his offense. This quick movement and swivels of the hips allow Thompson to keep up with faster guards approaching the paint. At times, Thompson will even stagger the penetrator before the latter can pass the charity stripe. His value as a team defender is far less apparent, but there are a number of positives accredited to Thompson’s name. As a taller guard, he can protect almost every spot on the court, as we see when he shuffles to the interior from up top to protect the paint from rolling forwards. As a result, Thompson is a very solid paint presence. With minimal errors in his defense, the only noteworthy ones being the mild tendency to ball-watch on coverages and some low-recognition plays, Thompson is a large positive on defense as a guard.

    Summary

    Contrary to popular opinion, impact metrics paint a very poor picture of Thompson’s value. His lower scores in the 2019 season include a PIPM of +0.26, a RAPTOR of +0.14, and a three-year luck-adjusted RAPM of +0.96. Then there are extremities like his -0.3 in Basketball-Reference‘s BPM and a -0.33 RPM. However, it’s worth noting impact metrics (except RAPM) are calculated with 1) the box score and 2) luck-adjusted on-off ratings. Thompson doesn’t exactly fill the stat sheet with assists, rebounds, steals, and blocks, and he’s gotten the shorter end of the stick in on-off totals. Golden State’s defense was 4.4 points more efficient with him off the floor and their offense was only a point-and-a-half better with him on the floor. Prorating these scores to a “neutral” environment and examining his impact across a variety of settings, I’d estimate Klay Thompson provides a random team with an increment of 9.13% odds to win a title at full-health.


  • Top 10 NBA Players of 2020

    Top 10 NBA Players of 2020

    (Cryptbeam)

    Ladies and gentlemen: it’s officially the most wonderful time of the year. Not because of Christmas, of course, but because it’s an ideal time to evaluate the league’s best players. With the Lakers’ game-six victory against the Heat closing the book on the 2020 season, now is the perfect time to reflect on basketball’s top talents; and what better way than with a top-10 list?


    Rationale

    This list intends to connect a player’s worth to a team’s ultimate goal – to win a championship. Therefore, the “best” players bring a team closest to a title. However, this isn’t a measurement of situational value, or how valuable a player is in his specific role on his specific team. I’ll look to connect a player’s “true” value, or how he’d impact a wide variety of teams, with increments in title odds. Resultantly, the placements on this list are partial to a trio of “portable” skills, or certain attributes that maintain value alongside better teammates: defense, passing, and shooting. The qualities of my criterion are similar to those of the CORP methodology because of a shared common goal: to, as stated earlier, connect a player’s value across a variety of environments to the degree of championship lift he provides.

    (Click here for a deeper review of my methodology)

    Disclaimer: This ranking does not assume all players are healthy. For example, if a player misses 2 of his team’s 10 postseason games, that player is credited with 80% of his full-heath championship equity in the Playoffs.


    10. Damian Lillard

    Lillard vaulted himself into the conversation as one of the league’s greatest offensive players this year. His lethal scoring repertoire, which consists of elite screen action, defensive spacing exploitation, and perimeter play resulted in an impressive 28.5 points per 75 on nearly +6.5 relative True Shooting. Lillard’s instrumental playmaking was a large asset for Portland, creating around 15 extra shots for teammates every 100 possessions. He doesn’t provide a ton of value off the ball, and Lillard’s postseason offense was clearly inferior to his regular-season self. Lillard’s defense is also problematic. His deep coverage and transition efforts make it hard to argue he’s a positive on that end, but the general premise of Lillard’s offense earns him a spot on this year’s list.

    9. Jimmy Butler

    Butler’s postseason play was the deciding factor in his spot on this year’s top-10. He maintained a decent scoring attack of 22 points per 75 on moderate efficiency in the regular season, but the latter’s Playoff changes were an influential factor in Miami’s Finals run. Butler improved by nearly five percentage points in the True Shooting department, enough to make his Playoff scoring elite. His facilitation drastically improved once separate from a drowned-out role in Philadelphia. Butler improved by four extra shots in the creation department, a figure he maintained in the second season. Butler’s great defensive impact, a mixture of low-error play, good positioning, and strong hands are of high worth to NBA rosters. His anchoring of a great postseason offense and perennially-strong defense made him a newcomer in my latest top-10 list.

    8. Nikola Jokić

    Jokić was nearly identical to his previous-season self: identical scoring and (adjusted) turnover rates and slightly higher efficiency and creation. Similarly, his 23.6 points per 75 and +3.7 rTS% in the regular season rose to 25.8 and +5.5 in the Playoffs, respectively. Jokić’s postseason change was on perfect display with his three-point efficiency, which vaulted to 43% on 5.4 attempts per 75. He continued his highly-effective “bully-ball” and perfected his pick-and-roll routine with teammate Jamal Murray. Jokić’s defensive remains the subject of criticism; his honey-bear build and slow feet don’t amplify his team’s defense. However, his quick reaction time and smart hand placements keep Jokić’s head above water in terms of defensive impact. Jokić’s role as a strong offensive cornerstone is applicable to a wide variety of teams, which paired with adequate defensive impact, makes Jokić one of the most equitable players in the league today.

    7. Luka Dončić

    Luka Dončić, in a season in which he was surely robbed of the MIP Award, took his offensive game to another level. Dallas featured the most efficient offense in league history, posting a 117 Offensive Rating in the regular season. Dončić’s having anchored that offense is a strong indicator of how good his offense is. He was near the top of the league in scoring rate, 31.1 points per 75, which he matched in the postseason, on stronger efficiency against a tough Clippers defense. Dončić was the true centerpiece of his team’s offense; he was “meaningfully” involved in roughly two-thirds of his team’s possessions. His offensive attacks, step-back jump shots, foul-drawing, and tough-shot making contribute to his world-class offense among a plethora of on-ball habits. Dončić’s defense is nothing to be impressed with: mediocre positioning, man, and off-ball defense, but his offense is enough to propel him safely onto this year’s list.

    6. Joel Embiid

    Embiid was quietly one of the league’s top players this season. He had a strong season as a scorer: 28.4 points per 75 on +2.1 relative True Shooting, which grew to 31.9 and +3.9 in the postseason, respectively. Embiid is a strong bully in the post with solid feet under the right care, which paired with undervalued passing and creation, makes him a strong offensive anchor in the post. However, the aspect of Embiid’s game that separates him from the players ranked below him is his defense. Embiid is antithetical to Butler in that his defense is more prone to error, but the benefits are of far greater return. He’s an extremely strong paint presence (career 4.8 block percentage) with solid pass anticipation, which paired with his maintained value in the Playoffs, sets Embiid apart from the rest of the pack. His strong post offense and world-class defensive impact are deciding factors in Embiid’s placement.

    5. James Harden

    James Harden continued his trend as one of the league’s elite offensive weapons in 2020. After posting the highest scoring rate in league history in 2019, Harden remained near the top of the leaderboards at 33.2 points per 75 possessions on high efficiency. In the Playoffs, his volume dropped to 29.3 points per 75, but his increased efficiency argues Harden had his best-scoring season in the Playoffs this year. His creation rates were consistent with the league’s top marks, exceeding 15 shots created per 100 in the regular season and 12 per 100 in the postseason. If Harden’s offense were more scalable or he provided more off-ball value, he would ubiquitously rank as the league’s top offensive player. However, given the “true” value of his offense and subpar defensive efforts, Harden comes in at fifth this year.

    4. Kawhi Leonard

    Leonard had one of his strongest regular seasons in 2020. He entered the upper echelons of scoring at 30.4 points per 75 on respectable efficiency. Leonard’s creation made a clear leap from last season, rounded at 11 shots created per 100. There were still instances of hesitance on Leonard’s passes, and it’s likely his playmaking estimates are a tad overrated, but his distinct improvements on that front gained him some offensive territory. Leonard’s defensive impact will likely never match his defensive talent as the two did earlier in his career, but Leonard remained one of the league’s top wing defenders in a mix of excellent hands, a prominent ability to clog passing lanes, and solid tracking on the perimeter. Leonard’s weaker profile in the postseason and limitations as an offensive engine diminish his ceiling on this list, but the totality of his championship equity ranks him near the top of the league this year.

    3. Giannis Antetokounmpo

    The Greek Freak had one of the greatest regular seasons of all-time according to the sport’s major impact metrics. Antetokounmpo led the league in RAPM, RPM, PIPM, and three BPM statistics (Basketball-Reference‘s, Backpicks‘s, and my own models). He led the league in scoring rate, 33.3 points per 75, on impressive efficiency, +5.2 relative True Shooting. The Greek Freak’s creation rates were approaching the top of the league, but similar to Kawhi Leonard, his hesitance to make tougher passes leads me to believe those figures are moderately overstated. His postseason dips aren’t close to remotely as dramatic as the average commentator will state: 31 points per 75 on +4 rTS% with similar creation rates. Antetokounmpo nearly doubled his relative offensive rebounding rate despite facing two of the league’s most prolific defensive-rebounding teams in Miami and Orlando. His absence in Game 5 of the Eastern Conference semis takes him down a notch on this list, but Antetokounmpo’s historical 2020 will remain a footnote in basketball history.

    2. Anthony Davis

    Anthony Davis makes arguably the strongest case as the league’s best frontcourt player of the season. His already elite box profile of 27 points per 75, 61 TS%, ~ 5 Box Creation, and +2.4 rORB% in the regular season leaped to 29.5, 66.5, ~ 6, and +2.9 in the postseason. Davis’s offensive profile is a great fit on strong offensive teams: strong scoring and efficiency as well as undervalued passing. Contrary to Giannis Antetokounmpo’s evaluation, Davis is a high-quality passer with lower creation rates. Davis’s shooting in the Playoffs (38% from 3) and improved play were focal points of the Lakers’ title run. However, the strongest facet of Davis’s résumé is his defense, a lethal mixture of awareness, great hands, positioning, and multidimensional coverage. His strong combo of offense and defense was good enough to blur the title of “best player” on the Lakers roster. Davis’s strong two-way play, especially in the postseason, propelled him to the second spot on this year’s list.

    1. LeBron James

    LeBron James refuses to age for another year as he contributes more championship equity than any player in the league once again. His impressive scoring repertoire as a strong driver and passable shooter, when paired with historical passing, makes James arguably the best offensive player of the year. He thrived as a primary ball-handler up top, skipping passes all over the court and converting on near-impossible chances. James’s value off the ball wasn’t as excellent, but his transferrable role as an offensive centerpiece is a strong point of his résumé. Contrary to 2019, James was a strong positive on the defensive end. His elite anticipatory movement, positioning, and rim protection contributed to a highly-valued defensive role in Los Angeles. James continued his career trend of improvement in the postseason, the deciding factor in his topping this year’s list. 


    I’ll defend my positions on these players, but there will always be some wiggle room in these rankings. The order in which the players appear on this list is not definitive, and a certain degree of shuffling wouldn’t drastically alter the results. With that, I’ll close the book on my top-10 players of 2020 player ranking. Now that we’ve cycled through another year of NBA basketball, I’m curious to read your guys’ top-10 lists. ⬇️⬇️ 


  • The Modeling and Principles of “Championship Probability Added”

    The Modeling and Principles of “Championship Probability Added”

    (? Medium)

    ForbesSports IllustratedBleacher ReportThe Washington Post, and ESPN. Five varying and mostly unrelated platforms. What do they have in common? In the past year, they’ve each taken a crack at composing a list ranking the NBA’s best active players. NBA commentators, critics, and fans are all acquainted with one or more of the aforementioned lists, each of which was followed with strong complaints. Instagram has a populous NBA community. The comment sections of related posts often feature two or more users lashing out at each other because of minor, negligible disagreements. If the league’s media has taught us anything, it’s that varying opinions can be the cause of severe conflicts, especially when it comes to ranking players.

    I’ve assembled my own lists over the years. The latest, which ranked the NBA’s top-10 players in the league, garnered strong criticism when sent to a focus group. My first and secondhand experiences with opinion-based conflicts led me to explicitly record the “methodology” of my player rankings. This article is also meant to accompany an upcoming list that ranks the top-10 players of 2020 to paint a clear and more detailed picture as to why certain players appear where they do. Based on an accumulation of theory, evaluation, and statistical modeling, here is the process that creates my player ranking lists.


    Framework

    Before composing a player ranking, I need to have an overarching ideology: a framework as to what constitutes the league’s “best” or “greatest” players. My attempt at forming a local structure to answer this question goes as follows: 1) a player is rostered with the hopes of improving the success of his/her team, a notion I believe most of us will agree on. 2) Teams possess the ultimate goal to win a championship, another notion I believe most of us will agree on. Therefore, the “best” and the “greatest” players bring teams closest to that goal: the primal ideology employed in my player-ranking lists.

    Similar criteria can be found in the CORP valuations at Backpicks, a measurement that introduced two key concepts I also use in my own rankings, the first being “portability.” Portability, also known as “scalability,” refers to how well a player’s situational value is held alongside better and better teammates. One way to think about this idea is to imagine James Harden, the recipient of the last three scoring titles, rostered alongside the likes of Giannis Antetokounmpo, Stephen Curry, Kevin Durant, LeBron James, and a heap of other NBA superstars. Would James Harden still score 30 points a night, or would his high-volume scoring be drowned out in the plethora of high-octane scorers alongside him?

    To differentiate between high and low-portability players, I’m partial to 1) a group of skills that Backpicks laid out in the site’s own post of similar nature and 2) historical observations of how a player changes from team-to-team. The following graphic serves to show the site’s definitions of skills and how they relate to scalability.

    Backpicks

    Evidently, the most “scalable” offensive skills per the legend are spacing, passing, and finishing (efficiency). Therefore, the sport’s more portable players typically display proficiency in the preceding skills. However, high-portability players aren’t exclusively defined as stated earlier. If a player shows the ability to maintain situational value on greater teams, regardless of “how,” it’s an example of high scalability. Stephen Curry is a great example relating to the former, skill-based definition of portability. He spaces the floor as well as any player in league history, displays excellence as a quality passer, and remains one of the sport’s most efficient scorers. Draymond Green is a great example relating to the latter, observation-based definition. He’s not a great spacer nor a superbly-efficient scorer, but his situational value took minor hits after the additions of multiple All-Stars to the Warriors’ roster. 

    What’s the significance of portability? It provides an optimal solution to a question of importance to me: how a player changes in different situations. As scalability was created for, a key aspect of a player’s championship equity is how that player impacts teams of varying quality. This is contrary to the conventional form of solely considering a player’s situational value, or how he impacts his single team: a single situation. My evaluations consider a player’s value on a wide range of teams, further gauging my definition of a player’s “true” value. If you were to watch the annual Thinking Basketball top-10 lists, you’d encounter the same overarching question I consider in my evaluations: which players give a random team to best odds to win a title?


    CPA Valuations

    To answer the proposed question, to determine which players provide the most championship lift across a variety of environments, I conduct player valuations at the end of a season. To gauge a player’s championship equity, I consider:

    • Film studies: random-sampling segments of a player’s games across the entirety of a season, targeting performances against varying qualities of opposing offense and defenses. This is the most useful step in understanding a player’s role on his team, information that is key for later steps.
    • Statistical profiles: quantifying a player’s actions on the court. Box scores and play-by-play data alone tell absolutely nothing about how good a player truly is, rather these profiles are an additional step in further understanding a player.
    • Impact metrics: in theory, the most important measurement tools we have. However, they only capture a player’s value on his own team; they’re measures of situational value. Comparing a player’s scores helps understand how different information (box score vs. on-off, etc.) measure s a player.
    • Numerical conversions: conforming a player’s “Regularized Adjusted Plus/Minus” (RAPM) to a neutral environment, i.e. an “average” team. That number is then plugged into a calculator that considers portability and health to estimate a player’s championship equity.

    The resulting measurement is denoted as a player’s “CPA,” or “Championship Probability Added.” Inspired by the aforementioned CORP metric, CPA measures the percent odds a player wins a title on a random team. The components of the “calculator” are based on fifty years of team data and theory to measure a player’s value. At this point in my player valuations, the fat lady starts to sing.