
(? Medium)
Forbes, Sports Illustrated, Bleacher Report, The Washington Post, and ESPN. Five varying and mostly unrelated platforms. What do they have in common? In the past year, they’ve each taken a crack at composing a list ranking the NBA’s best active players. NBA commentators, critics, and fans are all acquainted with one or more of the aforementioned lists, each of which was followed with strong complaints. Instagram has a populous NBA community. The comment sections of related posts often feature two or more users lashing out at each other because of minor, negligible disagreements. If the league’s media has taught us anything, it’s that varying opinions can be the cause of severe conflicts, especially when it comes to ranking players.
I’ve assembled my own lists over the years. The latest, which ranked the NBA’s top-10 players in the league, garnered strong criticism when sent to a focus group. My first and secondhand experiences with opinion-based conflicts led me to explicitly record the “methodology” of my player rankings. This article is also meant to accompany an upcoming list that ranks the top-10 players of 2020 to paint a clear and more detailed picture as to why certain players appear where they do. Based on an accumulation of theory, evaluation, and statistical modeling, here is the process that creates my player ranking lists.
Framework
Before composing a player ranking, I need to have an overarching ideology: a framework as to what constitutes the league’s “best” or “greatest” players. My attempt at forming a local structure to answer this question goes as follows: 1) a player is rostered with the hopes of improving the success of his/her team, a notion I believe most of us will agree on. 2) Teams possess the ultimate goal to win a championship, another notion I believe most of us will agree on. Therefore, the “best” and the “greatest” players bring teams closest to that goal: the primal ideology employed in my player-ranking lists.
Similar criteria can be found in the CORP valuations at Backpicks, a measurement that introduced two key concepts I also use in my own rankings, the first being “portability.” Portability, also known as “scalability,” refers to how well a player’s situational value is held alongside better and better teammates. One way to think about this idea is to imagine James Harden, the recipient of the last three scoring titles, rostered alongside the likes of Giannis Antetokounmpo, Stephen Curry, Kevin Durant, LeBron James, and a heap of other NBA superstars. Would James Harden still score 30 points a night, or would his high-volume scoring be drowned out in the plethora of high-octane scorers alongside him?
To differentiate between high and low-portability players, I’m partial to 1) a group of skills that Backpicks laid out in the site’s own post of similar nature and 2) historical observations of how a player changes from team-to-team. The following graphic serves to show the site’s definitions of skills and how they relate to scalability.
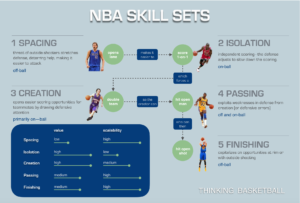
Backpicks
Evidently, the most “scalable” offensive skills per the legend are spacing, passing, and finishing (efficiency). Therefore, the sport’s more portable players typically display proficiency in the preceding skills. However, high-portability players aren’t exclusively defined as stated earlier. If a player shows the ability to maintain situational value on greater teams, regardless of “how,” it’s an example of high scalability. Stephen Curry is a great example relating to the former, skill-based definition of portability. He spaces the floor as well as any player in league history, displays excellence as a quality passer, and remains one of the sport’s most efficient scorers. Draymond Green is a great example relating to the latter, observation-based definition. He’s not a great spacer nor a superbly-efficient scorer, but his situational value took minor hits after the additions of multiple All-Stars to the Warriors’ roster.
What’s the significance of portability? It provides an optimal solution to a question of importance to me: how a player changes in different situations. As scalability was created for, a key aspect of a player’s championship equity is how that player impacts teams of varying quality. This is contrary to the conventional form of solely considering a player’s situational value, or how he impacts his single team: a single situation. My evaluations consider a player’s value on a wide range of teams, further gauging my definition of a player’s “true” value. If you were to watch the annual Thinking Basketball top-10 lists, you’d encounter the same overarching question I consider in my evaluations: which players give a random team to best odds to win a title?
CPA Valuations
To answer the proposed question, to determine which players provide the most championship lift across a variety of environments, I conduct player valuations at the end of a season. To gauge a player’s championship equity, I consider:
- Film studies: random-sampling segments of a player’s games across the entirety of a season, targeting performances against varying qualities of opposing offense and defenses. This is the most useful step in understanding a player’s role on his team, information that is key for later steps.
- Statistical profiles: quantifying a player’s actions on the court. Box scores and play-by-play data alone tell absolutely nothing about how good a player truly is, rather these profiles are an additional step in further understanding a player.
- Impact metrics: in theory, the most important measurement tools we have. However, they only capture a player’s value on his own team; they’re measures of situational value. Comparing a player’s scores helps understand how different information (box score vs. on-off, etc.) measure s a player.
- Numerical conversions: conforming a player’s “Regularized Adjusted Plus/Minus” (RAPM) to a neutral environment, i.e. an “average” team. That number is then plugged into a calculator that considers portability and health to estimate a player’s championship equity.
The resulting measurement is denoted as a player’s “CPA,” or “Championship Probability Added.” Inspired by the aforementioned CORP metric, CPA measures the percent odds a player wins a title on a random team. The components of the “calculator” are based on fifty years of team data and theory to measure a player’s value. At this point in my player valuations, the fat lady starts to sing.
Leave a Reply