Counting statistics are a traditional and necessary part of player evaluation. They quantify tendencies in ways more effective than any impact metric or eye-test could do. However, there’s a widespread phenomenon that has led some to believe the box score captures a player’s value to his team, which has questionable validity. Regardless, the more a counting stat indicates toward a player’s impact, the more valuable its consideration should be. Traditional box score stats don’t fit the archetype. (I tested the explanatory power of six sets of three-year box score profiles to three-year luck-adjusted RAPM, which held an R^2 of 0.44, suggesting the box score is not as strong an indicator of a player’s value as most would think.) Play-by-play and tracking data move the needle, but a lot of these stats are either deep underground, proprietary, or lack the context to truly reflect a player’s given skill.
I’ve stat-tracked in less intensive manners in the past, but the sample sizes limited the applicability outside of player evaluation (which still requires a lot of mental filtering). My second initiative in the field plans to yield far more useful results to not only identify statistical trends and expand our knowledge of how different stats relate to impact, but to dispel a common myth among the analytics community: the scoreboard is a perfect indicator of a player’s value. I once believed a “true” form of Adjusted Plus/Minus (APM), meaning perfect coefficient estimates and stability, would be the theoretical end-all-be-all to measure impact on a team. That changed when I started to rewatch certain possessions over and over again and inadvertently gained a deeper understanding of how frequently luck plays a part in basketball.
It was mere fortuity (and luck) the first player I did a rigorous stat-track for was Russell Westbrook. His style of play was a perfect framework to explain the effects of luck and how the scoreboard doesn’t reflect the value of certain possessions. Multiple times during his debut with the Wizards against the 76ers, Westbrook would provide a wagered form of help defense. He’d often cover a perimeter assignment near a corner while one of Philadelphia’s big men would post up (usually Embiid). Westbrook would abandon his man to rush over to the opposite block and swipe for the ball. Perhaps there is some merit to this decision, which blocks off the more efficient shot. But more often than not, the big wouldn’t have been in a distinct position to score, or even in an effective spot. If Embiid managed to pass out to Westbrook’s left assignment, the latter would have an open shot. If the shot is successful, it would represent Westbrook’s defensive action: having opened a field-goal attempt for the opposition. (Another way to think of such an event is allowing the other team an opportunity created on poor grounds.)
However, court actions don’t always have their intuitively-valid impacts (e.g. Westbrook leaving an assignment for a poor double-team will generally have a negative effect) reflected by the scoreboard. If Westbrook performed the same defensive action and his assignment missed the open field-goal attempt, he’s credited with having been on the floor when a shot was missed, thus inflating his defensive impact on the game score. To reverse some of these mislabeled possessions, I expanded the defensive box score to include “defensive errors,” an umbrella term that also stores several other statistics to categorize actions. Defensive errors, as of now, fall under one of the following terms:
- Missed rotation
- Blow-by
- Steal gamble
- Foul committed*
- Miscellaneous
* not in the fourth quarter for the purpose of getting the leading opposition to the free-throw line
Missed rotations are fairly identifiable. If a teammate makes a justified switch and the given player doesn’t counteract, he’s credited with a missed rotation. Blow-bys are simply when a player’s matchup is given an easy path to the basket due to poor man defense or a lack of attentiveness. (It’s important to distinguish between “matchups” and “assignments.” From here on out, a “matchup” refers to the opposing player a given player is guarding while an “assignment” is the opposing player a given player was expected to guard at the start of a possession, barring any switches. For example, when Westbrook left his “assignment” (the perimeter player) to guard Embiid, the “matchup” switched from the perimeter player to Embiid while the assignment remained constant.)
A gamble for a steal is one of the more ambiguous stats to track because of how different scorekeepers could interpret them in different ways.
Fun fact: similar to baseball’s “park factors” that account for ballpark dimensions and other confounding variables in setting, basketball has “court factors” that account for the variance in scorekeeper tendencies. The most common application of court factors is to normalize assists, a stat very subjective in its official definition, to compare them more accurately across teams.
For the purpose of the exercise, I would constitute a gamble for a steal as an attempt that was 1) not in a face-up guarding scenario or 2) a situation in which the defender had evidently low odds to induce a turnover based on his position relative to the matchup and the basketball. Westbrook accounted for several “reach-around” steal attempts in which his matchup would be in front of him, yet the gamble was performed. This is a perfect example of gambling for a steal. Jumping a passing lane is a more complex scenario. Westbrook didn’t have any significant examples of such an event in his seasonal debut; however, I planned to identify a gamble based on the defender’s footwork. If his natural reaction was to launch downcourt for an easy layup, he was using a high-risk, high-reward style while a defender who firmly plants his feet to prevent a lost ball on the attempt makes a “safer” attempt to steal.
Because I hadn’t categorized every possible defensive error preceding my stat-tracking, I used a “miscellaneous” option to sort any court actions that were clear defensive errors that didn’t fit under any of the categories. Westbrook committed four “miscellaneous” defensive errors in the game, including a possession in which he attempted to rebound an airball from the opposition. He changed his mind halfway through the jump and tried to avoid contact to let the ball roll out of bounds, but he’d managed to make slight contact. You could argue that because Westbrook had the ball in his hands the error was committed on offense; but in such cases, the offensive player has yet to fully gain secure possession of the ball. The second was a fairly standard error that would likely happen often enough to make its own category: poor hustle. Westbrook showed lazy coverage in a fastbreak for Philadelphia, which led to an open man on the run, increasing the odds of poorer defensive coverage for Washington, and therefore higher odds of giving up a shot.
Missed assignments are another assist-like stat that conforms to the mind of the scorekeeper. My definition of a missed assignment is when a player attempts a double (or triple, etc.) team that leaves his assignment in a blatantly-clear position to score. The earlier example of Westbrook covering Embiid would be a good example of a missed assignment. The fourth type works tangentially to the rotations category. Rather than making or missing a correct rotation, a “poor rotation” is when a player makes a rotation with a negative marginal value (for example, when a player rotates onto the wrong matchup and puts the opposition at better odds to score). With a measure of defensive errors, I could track how luck plays a role in scoreboard-oriented metrics with a stat called “defensive error percentage,” or how likely a player is to commit a defensive error in a given possession. It’s simply the sum of all a player’s defensive errors from a given period divided by the number of possessions in which they played.
The value of defensive error percentage is how it provides a clearer picture of defenders whose scoreboard impact doesn’t reflect the value of their court actions. Take Hassan Whiteside of the Sacramento Kings as an example. He’s generally seen as one of the most error-prone defenders in the league, but his defensive impact metrics are quite good. The confounding variable in this equation is luck (as well as Whiteside being an elite shot-blocker). A greater understanding of his defensive value comes from a more comprehensive box score rather than an assimilation of steals and blocks. As mentioned earlier, Westbrook tends to gamble on steals and make some questionable rotations, so we can use his defensive error rate as a reference. Listed below are his total error percentage on defense and the proportions that come from each type:
- Defensive Error Percentage: 16.4%
- Missed Rotations: 27.6%
- Blow-bys: 13.8%
- Gambles: 17.2%
- Fouls committed*: 13.8%
- Miscellaneous: 27.6%
With this data, I could also measure the success rate of Westbrook’s rotations. Although he’s a fairly troubled defender in general, his role as a coordinator is underrated. Throughout the game, he would continuously direct teammates to correct new matchups and organize the floor to counteract Philadelphia’s offensive schemes. Westbrook successfully executed 88.9% of his potential rotations.
The remaining defensive stats I tracked were “defensive usage” and opponent efficiency. Defensive usage is simply the percentage of possessions in which a given player’s matchup either attempted a field-goal, went to the free-throw line due to a foul from the measured player, or turned the ball over (the turnover has to be induced by the measured player). It gives additional context to a player’s defensive role to provide a better statistical tool to measure a player’s involvement in a defense. It’s the counterpart to the offensive version known as usage percentage. Westbrook had a “defensive usage” of 13.1% in the 2021 season opener. I consider my definition of opponent efficiency far more indicative of a player’s ability to affect field-goal attempts than, say, defensive field-goal percentage. My form uses effective field-goal percentage to measure the points a player allows (you’d rather concede a two than a three) and tracks the matchup rather than the assignment because players aren’t often guarding their assignment at the end of each possession. Westbrook allowed an effective field-goal percentage of 54.5% in the tracked game, which would place a few ticks higher than the expected league-average in the stat this season.
—
A strong emphasis was placed on defense in the exercise because of the lack of true defensive measuring tools in the form of counting statistics, but it would be unwise to ignore any offensive counterparts. The most important stat I tracked was “opportunities created,” a concept formed by Ben Taylor nearly ten years ago. Similar to assists, an opportunity created has vague criteria, with biases likely occurring from person to person. Taylor roughly defined as drawing the defense in such a manner that creates either 1) an open field-goal attempt, 2) a clear opportunity for a “hockey” assist (pass that leads to an assist), 3) drawing a foul at the rim, or 4) an offensive rebound followed by a putback. I had one major philosophically qualm with the definition he gave because, more specifically, the last two events do not always result in an opportunity created. A foul at the rim and a putback that directly follows an offensive rebound can each be contested by a single defender only, which leaves all teammates (of the offensive player) accounted for by a defender. Therefore, my definition of an “opportunity created” was simply when the defense was tugged by a player in such a manner that a potential field-goal attempt was opened.
There was one more phenomenon to be accounted for in designating a created opportunity. When a player is located at a corner with the ball in his hands, especially one of significant shooting prowess, the weakside help will often leave space between their matchups. This distance is just enough for the defender to rush back in time to contest a shot if the assignment were to be passed to, but enough that the latter would have an open shot if the ball were immediately placed in his hands. Therefore, I was targeting “significant” defensive manipulation, which I defined as any defensive positioning that created an opportunity that also contradicted any “natural” movement. This meant players opened by the loose guard of weakside defenders wouldn’t be credited as an opportunity created. Despite a narrower definition, this stat wasn’t easy to track. It’s not always clear which player created which shot, which is a large reason for my gratitude toward pause-and-play buttons. Tracking opportunities created is similar to crediting assists; close calls are decided by your best judgment.
A large part of my criteria on these tougher calls would be to observe the body language of the defense. Weakside defenders could stray farther away from their assignments, but if they exhibit clear attention to the assignment, then there’s no opportunity created. If the defender distinctly abandons the assignment to move toward the measured player, then it’s an opportunity created. A lot of these scenarios can be told by the defender’s eye movement (are they watching both the assignment and the handler?) and how they shuffle their feet (is there a continuous movement to one side or does it resemble more of a back-and-forth motion?). Opportunities created were difficult to identify at first (I had to watch the entire first quarter three times over to get in rhythm), but eventually, the motions and reactions of defenses become more and more clear. As I accrue enough games to build a sufficient and diverse sample size, I may build a regression model that approximates the number of opportunities created for a player, similar to Taylor’s “Box Creation” metric.
My secondary tracking technique on offense was to grade a player’s passes on the one-to-ten scale seen in Backpicks‘s “Passer Rating” metric. Similar to a metric that approximates opportunities created, I’ll eventually construct a counterpart for passing ability to solely measure the quality of a player’s passing. I wouldn’t recommend grading passes to the more inexperienced watchers, but as you watch more and more game film and use more lenient criteria (I used increments of one), then the process becomes relatively easy. Passing quality was perhaps the most intriguing stat to track because of how unstable it can be from pass to pass.
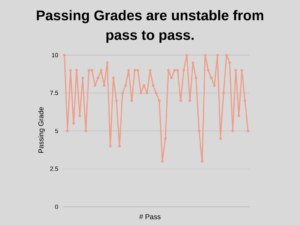
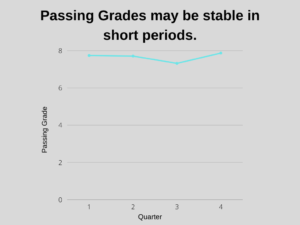
The variability on a “per pass” basis was expected, especially for a player like Westbrook. He’s one of the very best in the world, but sometimes he’ll throw some loose cannons. A detail I needed to work out as I tracked more and more passes was to choose between bases for a potential regression model. I could take full-season samples, but it worth exploring the potential of explanatory power on a per-game basis. After all, some players have great passing games and then have poor passing games; statistics taken from the individual games may hold some merit against passing grades. I also chose to track the change in the tracked statistics from quarter to quarter, and the consistency of his passing grades was uncanny (Westbrook played roughly equal playing time during each quarter).
My plan for the future is to track all of Westbrook’s (my favorite player) games and samples of the league’s stars (for an end-of-season ranking). I may try to extrapolate game logs for players to fit a full-season estimate, although the room for error would be high. It all depends on how stable the stats are from game to game. The 2021 season is still very young, and even after hours upon hours upon hours of intensive stat-tracking, there is still a lot of room for exploratory work.
Listed below are a few interesting stats that stood among the first few games of the 2021 season:
- Russell Westbrook passed the ball sixty-one times versus Philadelphia, nearly 170% of LeBron James’s activity versus the Clippers
- Kyrie Irving’s sixteen defensive errors vs. Golden State on opening night, a mark only contested by Russell Westbrook versus Philadelphia (14)
- Russell Westbrook’s thirty-two made switches and rotations versus Philadelphia
- And the most impressive of them all, Stephen Curry’s twenty-nine opportunities created versus Brooklyn
Edited note: a few comments on my exact definition of a “rotation” for the purpose of stat-tracking
-
When a player is distinctly covering one matchup and opts for a new one for the purpose of preventing penetration and/or a shot opportunity.
-
If it’s simply a two-man switch to make a small change in coverage, especially on the weak side, it’s not really a rotation.
-
I wanted to loosen the definition enough so that it captures a player’s awareness and movement, but strict enough so that a meaningless switch of sorts isn’t counted.
Leave a Reply