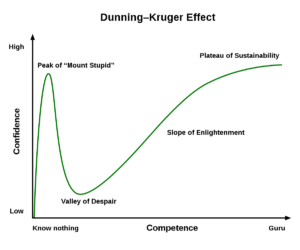
Proposed by social psychologists David Dunning and Justin Kruger in 1999, the Dunning-Kruger effect explains a form of cognitive bias by describing the stages of a person’s progression in a field. The premise is that someone will often overestimate their abilities as they dip their toe into the field because they lack the introspection to assess the quality of their knowledge. As they become more exposed to the field, they begin to recognize that they lack key information to identify “high” knowledge. What follows is a continuously gradual period of growth in which the person attains both increasingly more knowledge in the field and the self-evaluation skills they once lacked. The “curve” that documents this journey is pictured below.

As is with many other fields, the Dunning-Kruger effect is present in learning about basketball statistics. Having undergone a similar journey myself, there’s no other player in NBA history that exemplifies the Dunning-Kruger effect than Wilt Chamberlain. His individual statistics are treated as unprecedented, reigning high and above any other player ever. Perhaps there’s some validity there, but the larger theme here is how these stats should be interpreted. Using Wilt the Stilt as the guideline, here is the Dunning-Kruger curve of basketball statistics.
The Peak of “Mount Stupid”
As labeled on the above graphic, “Mount Stupid” acts as a representation of the first stage of the Dunning-Kruger effect. The person believes they are equipped with enough knowledge to proclaim expertise despite an introductory level of proficiency in the field. This is the stage in which, clearly, statistical analysis is the most limited, strictly adherent to the box score. Additionally, there is the false belief that all notable statistical information is captured in the box score. Active basketball watchers know there’s a whole lot more going on outside of what’s recorded in the box score; hence, the peak of “Mount Stupid.”
For these reasons, some may see Wilt Chamberlain as the greatest NBA player of all time due to his unmatched combination of volume scoring, rebounding, and assisting prowess. Chamberlain’s career average of 30.1 points per game has only ever been challenged by Michael Jordan, and his rebounding average of 22.9 rebounds per game is the highest mark in league history. This type of statistical dominance was held in his peak seasons, one of which is commonly seen as the 1962 season in which he averaged 50.4 points per game. The Stilt holds the top-four seasons in points per game in league history, and the next-closest player ever since was Michael Jordan’s 37.1 points per game in 1987.
Chamberlain’s aforementioned assisting dominance trickled in as his scoring went down and he undertook more of a facilitating role in Philadelphia. Even today, his 8.6 assists per game in 1968 leads all centers in NBA history. This level of raw statistical dominance is incredibly captivating, characterizing the Stilt as arguably the most well-rounded and commanding player in league history. But, again, as some of us know, the implications of Chamberlain’s historical statistical profile run far deeper than how they are taken at face value. Additionally, these crude box score statistics miss out on a lot of the advanced techniques developed over the years, which we’ll dive into later.
Key Takeaways of Stage 1:
- Wilt Chamberlain averaged a lot of points, rebounds, assists, etc., and his unprecedented per-game statistics mean he’s the most statistically dominant player in NBA history.
- Box score stats are taken purely at face value, e.g. a 23 points per game scorer with a field-goal percentage of 50% is a better scorer than a 21 points per game scorer with a field-goal percentage of 47% because of these numbers.
- The entire lack of consideration for how different statistics, box score or not, have an effect on the team levels. This “Stage 1” mindset also glosses over the much-needed contextualization methods of today.
The Valley of Despair
After a while, it becomes much clearer that the box score is a mere fraction of what should make up the totality of a player’s “statistical” impact. Recognizing the box score fails to track such crucial information is a trademark quality of the “Valley of Despair,” which occurs when the person becomes aware of how little they know. For example, the assist is the universal proxy for playmaking talent, recorded each time a player’s pass leads directly to a teammate’s made shot attempt. Disregarding the philosophical disparities between stat-trackers, the assist is entirely dependent on the teammate making the shot; meaning a player’s assists figures can either be inflated or deflated based on the quality of the players around him. Namely, comparing assists between players will never be an apples-to-apples comparison. [1]
While Stage 2 is similarly characterized as one when the person still lacks a significant amount of knowledge, the questioning of the Stage 1 methods acts as the catalyst to unlocking a broader understanding of statistics. Because this usually accompanies an increased awareness of how teammates and coaching influence a player’s statistics (e.g. the assists example), questions will naturally arise that ask whether a more stuffed stat line is truly better than another. The previous case of two scorers exemplifies this well. If “Player A” averages 23 points per game on (let’s use a more sophisticated measure of efficiency) 57% True Shooting, is he automatically a “better” scorer than Player B and his 21 points per game on 54% True Shooting?
Wilt Chamberlain’s revered 1962 season is a campaign that should similarly evoke these questions. We know he averaged an absurd 50.4 points per game, but could those points have come at the expense of something else? The Stilt averaged a mere 2.4 assists per game, which heavily suggests he was heavily slanted towards scoring as opposed to creating for teammates. Questioning the value of Chamberlain’s “black hole” signature style connects the player to the phenomenon.
Key Takeaways of Stage 2:
- The questioning of whether box score stats should be taken as absolute measures; the increased awareness that stats like points, rebounds, and assists are accrued in different environments, setting forth the concepts of inflated and deflated statistical profiles.
- Although the exact countermeasures to the box score’s inherent flaws aren’t to the person’s knowledge yet, they recognize the need to search for them, meaning they’ve reached the point at which they understand they lack proficient knowledge.
The Slope of Enlightenment
Referring to the Dunning-Kruger effect graphic above, the Valley of Despair is immediately followed by the continuous increase of knowledge in the field. As the previous recognition of one’s own inexperience sets in, they begin to search for alternative methods to the ones they had once misused. This creates a continuous period of growth in which new information is constantly made to be readily available for the person to absorb. Pertaining to the subject of Wilt Chamberlain, there are multiple of the aforementioned “contextualization methods” that shed light on the value of his juggernaut scoring and whether or not it made him the greatest individual (or “statistical”) player of all time.
Perhaps the most common of these tools is the pace-adjusted statistic, which was introduced to a more even playing field to compare players across eras. For example, using Basketball-Reference‘s pace estimates, Wilt Chamberlain’s Warriors of 1962 accumulated 131.1 offensive possessions per 48 minutes. Because Wilt Chamberlain played every minute of every game, including overtime, he had roughly 132 chances to rack up stats every game during this season. For reference, the fastest-paced team of the 2021 regular season (the Washington Wizards) averaged 104 possessions per 48 minutes. This huge disparity in opportunities is used to add context to Chamberlain’s scoring averages in the following fashion:
Because we like to express statistics in a modernized fashion, box score stats are often represented as “per 75” measures, calculating the number of stats a player accrues every 75 possessions he’s on the floor. [2] Using Chamberlain’s 1962 scoring total with the previous pace estimate, we know the Stilt scored a total of 4,029 points in roughly 10,597 possessions. This means his “per-75” scoring average is a more realistic 28.5 points rather than 50.4 points. For reference, the closest player to Chamberlain’s scoring rate in 2021 was Zach LaVine (28.3 points per 75) of the Chicago Bulls, who ranked tenth among all qualified players.
Key Takeaways of Stage 3:
- The countermeasures for the concerns expressed in Stage 2 are put into action, with the person continuously gaining knowledge on enhanced statistical practices and implementing them to discover new information on players and teams.
- The use of more sophisticated measures to quantify player actions, e.g. points per 75 instead of points per game (in addition to even savvier inflation-adjusted measures), True Shooting percentage (or relative True Shooting) instead of field-goal percentage.
The Plateau of Sustainability
While the word “plateau” suggests a lesser growth in knowledge after Stage 3 (this is not the case), the fourth stage is more the product of the previous three having laid the groundwork for further analysis. The person is now able to independently function as proficient in the field and continue to research these phenomena and add onto insightful reasonings. This is when even more of the advanced work happens, and there’s a whole lot of thought-provoking stuff on Chamberlain that counterbalances the extremities of his raw box scores.

(? Backpicks)
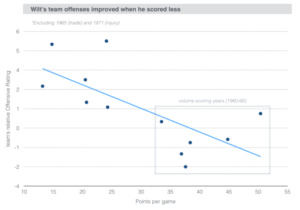
As it turns out, the previous questioning of whether Chamberlain’s scoring offset other important offensive actions was valid. The above chart plots the relationship between Chamberlain’s per-game scoring averages by season and his teams’ offensive ratings (points scored per 100 possessions). Clearly, there exists a massively negative correlation between these two variables. How do we interpret this? Well, there’s the unavoidable confounder of team changes and teammate development, so some of this relationship should be taken with a grain of salt. But this career-long trend is a damning piece of evidence that tells us something.
Because Chamberlain was not an elite shot creator (Box Creation, and estimate of shot creation, said Wilt created roughly 2 to 3 shots for teammates every 100 possessions throughout his career), his tendency to take a ton of shots held back some of his higher-level teammates, bolstering his individual scoring statistics at the cost of the team’s overall efficiency. The disparity between his individual statistics and his team-level impact holds true in impact estimates like WOWYR (With Or Without You, Regressed). As perhaps the most robust measure of historical impact we have, WOWYR divvies credit for a healthy lineup’s success among the heart of its lineup.
Chamberlain’s prime seasons estimated his impact as worth +5.2 points per game, which would still make him one of the very best players in the history of the sport. But a player with “poorer” individual statistics, Bill Russell, had a mark of +6.7 points per game. So while Chamberlain is still an all-time great basketball player, one of the ten very best to my estimation, the rawest forms of his stats are not reflective of how “good” of a player he was, and therefore, his statistical efficacy.
Key Takeaways of Stage 4:
- The increased understanding the statistical analysis does not decrease the breadth of information to analyze; i.e. rigorously adding context to a player’s statistics.
- Establishing more connections between a player’s actions and presence and team performance. Because players are employed to help teams win games, this is what we really care about.
- Leveraging more robust data to ballpark not only how valuable a player is to a team, but how valuable any player can be, e.g. how much closer can a role player, All-Star, or MVP take a team to a championship.
[1] There’s also the larger, overarching debate of the differences between assist qualities. The “Rondo Assist” was coined to identify assists that were barely the product of the passer, meaning the shooter did all the work.
[2] We use the “per 75” measure because a typical NBA game nowadays lasts roughly 100 possessions and some superstars will play roughly 36 minutes per game. (36 minutes is 75% of the 48-minute game.)

Leave a Reply