Category: NBA


  • How to Interpret NBA Impact Metrics [Video & Script]

    How to Interpret NBA Impact Metrics [Video & Script]

    NBA impact metrics, despite acting as some of the best tools available to the public today, are frequently misinterpreted. What are some ways to look at impact metric scores and use the data to our best advantage? Are there cases in which largely lower-score players are “better” than higher-score players? As a relatively avid user of these stats, I dive into the tips and tricks I’ve gained over the past few months on how to make the best use of these metrics.

    Video Script:

    Good afternoon everyone, and welcome back to another discussion on NBA impact metrics. So recently, I’ve been talking and writing about impact metrics more than usual, and that’s because there’s still some level of mystery surrounding them in the public eye. Anyone can hop onto Basketball-Reference and see that Russell Westbrook had a league-leading +11.1 Box Plus/Minus in 2017, but what does that actually mean? For the more dedicated NBA fan, these numbers might be seen every day through an endless series of acronyms of BPM, EPM, RPM, PIPM, RAPM, RAPTOR, or whichever metric that happens to be perused that day. Because of this, I’ve decided to sit down today and discuss the interpretations of these impact metrics, not only to set some of the records straight on what they truly mean but as an aid to make more reliable conclusions based on these types of data.

    Before we begin, if you missed my discussion of how impact metrics are calculated, feel free to scroll down to the description box; I’ve linked that article as a precursor to this video as some optional context going into this.

    With that out of the way, let’s go over the definition of an impact metric that I laid out in that article, which goes as follows: “Impact metrics are all-in-one measurements that estimate a player’s value to his team. Within the context we’ll be diving into here, a player’s impact will be portrayed as his effect on his team’s point differential every 100 possessions he’s on the floor.” So when we refer back to Russell Westbrook’s Box Plus/Minus in 2017, we know that metric says he provided an estimated +11.1 points of extra impact every 100 possessions he played. Now, this understanding may suffice to recognize a score, but what we’re looking for here is a strong interpretation of these metrics because, unless the nuances of each metric remain present in the mind, some of the inferences drawn from these data points will lead to much poorer interpretations of what’s happening on the basketball court.

    Let’s begin with some universal rules that can be applied to nearly every widespread metric. They only capture a player’s value to his specific team in his specific role. And if that doesn’t sound like a problem at first, consider this example. Arguably the top-2 NBA point guards in 2016 and 2017 were Stephen Curry and Russell Westbrook, and they both had the best seasons of their careers within these two seasons. Curry had his mega-spike in the 2015-16 season while Westbrook followed that MVP case with one of his own in 2017 when he averaged a triple-double. Let’s look at their scores in Box Plus/Minus during these seasons. When Curry had his peak, he posted an Offensive Box Plus/Minus of +10.3 and an overall score of +11.9, which to this day stands as one of the highest marks since the merger. The following season, he had a very impressive yet significantly lower +6.7 Offensive Box Plus/Minus and a +6.9 total score. So was Steph really 5 points worse in 2017 than he was in 2016? Of course not. This phenomenon was created when the addition of Kevin Durant absolved some of Curry’s role in the effort to help the two stars coexist on the court together. If the logistics behind that alone doesn’t make sense, just look at some of Curry’s box score stats when he played without Durant in 2017 compared to his bigger role in 2016.

    2017 (w/o KD): 39.5 PTS/100, 9.9 AST/100, 7.3 FTA/100

    2016: 42.5 PTS/100, 9.4 AST/100, 7.2 FTA/100

    The same events happened in reverse with Russell Westbrook, coincidentally enough because of the same player. With Durant in OKC in 2016, Westbrook had an Offensive BPM of +6.4 and an overall score of +7.8. After Durant left for Golden State that offseason, Westbrook posted an offensive score of +8.7 and an overall score of +11.1. So we ask again, was he really +3.3 points better a mere season apart? Of course, we answer again as we did with Curry: no. Westbrook simply took on a larger role; in fact, a much larger role. His usage rate increased a whopping TEN percent between the 2016 and 2017 seasons. That’s an unprecedented amount of change in such a short amount of time! Let’s use the same technique we did for Curry and compare Westbrook’s 2016 box scores when Durant was off the floor against his historically great solo act the following season.

    2016 (w/o KD): 40.7 PTS/100, 15.3 AST/100, 13.0 FTA/100

    2017: 44.8 PTS/100, 14.7 AST/100, 14.7 FTA/100

    The takeaway here is that impact metrics are extremely sensitive to a player’s role and only estimate what they’re doing in their specific situations. This means players who are poorly coached or are being assigned to a role that doesn’t fit their playstyle will always be underrated by these metrics while players who are utilized perfectly and play a role tailored to their style will always be a bit overrated. This type of significant confoundment will be found more often in box-only metrics than play-by-play informed ones; but star players on more top-heavy rosters will also see inflation in their on-off ratings, even after adjusting for some forms of luck.

    The next thing I’d like to discuss is how to interpret impact metrics in large groups. I’ve seen some claims that say one metric on its own isn’t entirely telling, but a healthy mix of a lot of metrics will be significantly more telling. Despite the fact that almost all notable one-number metrics attempt to estimate the same base measurement, RAPM, I still struggle with this idea; and that’s because every one of these metrics is created differently. Box Plus/Minus only uses the box score; PIPM uses the box score as well as luck-adjusted on-off ratings, RAPTOR uses both of those in addition to tracking data. I wouldn’t go so far as to call this an apples-to-oranges comparison, perhaps more along the lines of red apples to green apples. Averaging out five or so metrics might get closer to a true value, but it doesn’t necessarily move the needle as effectively as viewing each metric individually and considering the nuances. But I also won’t say this is entirely more useful, as these metrics still do use a lot of the same information. One form of confoundment for one metric will likely be present to some degree in another.

    The last main topic I’ll talk about here is how to interpret impact metrics within their sample size. At the time of this writing, NBA teams have played an average of 52 games so far, yet there have been cases of 50-game samples of these metrics treated just the same as a 250-game sample. This is where I’ll introduce the variance among these metrics. I’m a part of a biweekly MVP ladder ranking over at Discuss The Game, the profile to which I’ll also link in the description box, and in the discussion room filled by the panelists, I saw a lot of talk early on in the season that compared impact metric scores of the candidates. I only found this interesting because, as the panelist with arguably the highest usage of impact metrics in an overall sense, here I was the panelist with the least reliance on these stats. So why was this shift so significant? It paints a picture of how variance is often treated among basketball stats. NBA analyst Ben Taylor discusses “sample-size insensitivity” in his book, Thinking Basketball, which states most fans will often not consider the possibilities that lie beyond the scope of an allotted time period. This means that almost every team that wins the NBA championship is crowned the best team of the season. But what if the same teams replayed the same series a second time? Perhaps a third time? Hypothetically, if we could simulate these environments thousands of times, we’d have a much better idea of how good players and teams were during certain seasons. Because, after all, a lot of confounding results that don’t align with observable traits could be nothing more than random variance.

    So, with the bulk of this discussion concluded, let’s go over the biggest points in interpreting an impact metric score. When working with larger samples that span at least a season, perhaps the largest factor to consider is role sensitivity. Because these metrics only estimate how valuable a player is in his specific context, these aren’t estimates of how good a player would be across multiple environments. So in this sense, “value” versus “goodness” has some separation here. Look at these measures as ballparking values for how a team’s point differential shifts with versus without a player, subject to the inflations or deflations that come along with the circumstances of a player’s role and fit on that team. The next part of this relates back to assessing scores in groups. A simple averaging won’t suffice; each metric was made differently and should be treated as such. Instead, I prefer to use these different calculations of impact as a reference to which types of data prefer different types of players. So while almost all of Westbrook’s value can be detected by the box score, often with some overestimation, someone like Curry, who provides a lot of unseen gravity and rotational stress, won’t have a lot of his more valuable skills in consideration with these measurements. The last, and arguably the most important, is to interpret an impact metric based on its duration. Similar to how an RAPM model’s scores should be interpreted relative to its lambda-value, an impact metric score should be interpreted relative to its sample size. After ten or twenty games, they may be more “right” than they are “wrong,” but they aren’t definitive measures of a player’s situational value, and are even more confounded than the limitations of the data that goes into these stats. This means while one player can appear to be more valuable to his team, when in fact the counterpart in this example will prove to have done more in the long run.

    So the next time you’re on Basketball-Reference or FiveThirtyEight or wherever you get your stats, I hope this helps in understanding the values of these metrics and how to use them appropriately and in their safest contexts, Thanks for watching everyone.

    https://www.youtube.com/watch?v=YqRVEkTtacA


  • Are the Brooklyn Nets the Title Favorites?

    Are the Brooklyn Nets the Title Favorites?

    After the minor blockbuster deal that relieved Blake Griffin of his athletic duties in Detroit and eventually landed him in Brooklyn, the world started to ask if his acquisition moved the needle even more for the Nets’ championship hopes. Naturally, this sets forth the question of Brooklyn’s Finals likelihood before the signing, and whether or not Griffin actually changes those odds.

    The Raw Numbers

    The aggregate Brooklyn Nets team so far, meaning the inclusions of stints with and without the later additions like James Harden, is not on track to win the championship. With an SRS of +4.65 through their first 37 games, the Nets would be on track for 54 wins during a regular 82-game season (corresponds to a rough 65.5% win percentage). Compared to their actual win percentage of 64.9% (24 – 13), a small argument could be made that Brooklyn’s record is currently understating them, although the difference isn’t even enough to add an extra win to their “Pythagorean” record.

    Historically speaking, NBA teams don’t enter legitimate title candidacy with an SRS below +5. According to Ben Taylor’s CORP overview on Nylon Calculus: “Since Jordan returned in 1996, no healthy team has hung a banner with an SRS differential below 5.6 and only one (the ’03 Spurs) was below 6.6.” (This was written before the Raptors hung their own banner in 2019). This means, assuming Brooklyn doesn’t obtain some major catalyst for the second season, either in terms of roster development or team chemistry, they aren’t viable pick as the “title favorites.” However, these figures aren’t totally representative of how good the Nets are right now, as they included games before the addition of James Harden and all of them exclude the efforts that Griffin will bring to the table.

    Brooklyn with Harden?

    Because Griffin, a very good player in his own right, will make a lesser impact on the Nets than James Harden, the latter player is the more important focus when gauging the team’s championship likelihood. Harden’s larger role and greater influence on the scoreboard will resultantly have a more significant impact on whether or not Brooklyn eclipses the cluster of “good-not-great” teams and into championship contention.

    During the past, we’ve seen that bringing in more star talent is not additive. When the Golden State Warriors won 73 games in 2016 they were evidently a super-team, posting a +10.38 SRS and nearly claimed the title as the greatest team ever before falling to LeBron James’s Cavaliers in seven games (although I don’t think the Finals loss necessarily topples Golden State’s case, either). When they replaced (mostly) Harrison Barnes’s minutes with a peak Kevin Durant, they clocked in as a +11.35 SRS team in 2017. (We’re controlling for low-minute, replacement-level additions and subtractions as near negligible). Based on the historical distribution of Adjusted Plus/Minus data, a +1 player wouldn’t even be an All-Star level contributor. Does this mean Kevin Durant wasn’t even as good as a “sub” All-Star in 2017? Of course not. But his value to the Warriors was likely closer to that number than the same figure if he were on an average team.

    My “portability” curve estimates in which players are grouped into five tiers – the graph shows the change in per-game impact for a +4 player across all tiers and team SRS (x-axis) differentials greater than zero.

    This is why there were so many concerns surrounding James Harden’s arrival in Brooklyn. Would the immersion of so many offensive superstars, especially ones that lack some of the “portable” traits we saw succeed in Golden State, it was perfectly reasonable to suggest that diminishing returns would eventually kick in with the Nets and their offense would nearly plateau. But has this been the case? Through Harden’s first 23 games in Brooklyn, the offense has been scoring 123.3 points every 100 possessions with him on the floor, which would comfortably finish as the greatest team offense of all-time, as well as being a mark comparable to Curry and Durant’s team offenses in Golden State. But similar to those Curry-Durant lead teams, having a historically-great offense with stars on the floor doesn’t guarantee a championship (plus, Golden State fared very well in a department in which Brooklyn severely lacks: defense).

    With Harden off the floor, Brooklyn’s offense scores 116.3 points every 100 possessions: still a very good team offense, but not nearly as good when the Beard is checked in. Does this mean Harden contributes +7 points every 100 possessions to the Brooklyn Nets? Not necessarily. On-off ratings are highly influenced by how a team staggers its playing time, i.e. a player may spend all his minutes with the team’s stars or the team’s scrubs. However, if we comb through the Nets’ n-man lineups, we can gain insight as to how the additions and replacements of one of Durant, Harden, and Kyrie Irving would increase the team’s offensive heights.

    (? PBP Stats)

    It’s no surprise that the Nets’ offense is at the peak of its powers when Durant and Harden, the team’s two best offensive players, are on the court together, posting a whopping 126.4 offensive rating. Now let’s look at how Durant and Irving-led offenses fare: a similarly outstanding 121.8 points per 100. A five-point SRS difference could be the difference between near-locks and playoff contention; however, we’re already seeing a declination in Harden’s supposed influence on Brooklyn’s offense. But wait, there’s more! Let’s look at the Nets’ four-man units to further gauge Harden’s offensive value in Brooklyn.

    (? PBP Stats)

    There are some really interesting implications here. Using five of Brooklyn’s regulars, take a look at the Brooklyn offense without Kyrie Irving: still a great 120.1 offensive rating. If we take DeAndre Jordan, the worst offensive player, out of the lineup and replace him with Kyrie Irving, the offense only improves by +1.1 points every 100 possession. Even giving Irving the easier route using Jordan as the control rather than, say, Joe Harris, the diminishing returns effect is perfectly clear. Replicating the same exercise for Harden – looking at how good his offenses are compared to Jordan’s – we get an estimate of +5.7 points of offensive impact every 100 possessions. This is similar to what has been suggested so far and is thus no surprise. However, what is surprising is where Kevin Durant stands in this approach.

    With Brooklyn’s four best (healthy?) offensive players on the floor (the Big-3 and Joe Harris), they score an astronomical 126.9 offensive rating. Once again, with DeAndre Jordan in Durant’s place, we see that mark take a minor toll to a 126.7 offensive rating. Does this mean Durant is only worth +0.2 points every 100 possessions to the Nets’ offense? Of course not. It doesn’t only defy the rational suppositions we have on Durant’s value, but there is some level of confoundment here. The extenuating circumstances do permit leniency, but lots of observed basketball trends still hold here. However, this does relate to later ideas we’ll explore. Lastly, the most damning piece of evidence in favor of the “portability” conundrum is how Joe Harris falls into the equation. A low-demand, high-efficiency shooter – an ideal mold for a complementary offensive piece – would have some of these diminishing returns alleviated, right? It turns out that’s more than true.

    (? Backpicks – Do Joe Harris’s more “scalable” traits make him even more valuable to the Nets’ high-powered offenses than their stars?)

    Without Joe Harris in the lineup among these five players, Brooklyn’s offense hits a low at a 118.1 offensive rating. Similar to the “replacement-level” route used for the previous three players, let’s look at the “Big-4” offense once more: the same astounding 126.9 offensive rating. That means, relative to the game setting and substitution, Joe Harris was worth +8.7 points more to Brooklyn’s high-level offenses relative to DeAndre Jordan. Perhaps let’s even the playing field out more. With Kyrie Irving as the replacement player, Harris’s offenses are +2 points more efficiency every 100 possessions. This is a very significant indicator of Harris’s “portability” in the Nets’ lineups. Does this mean he’s a more valuable offensive player than Irving? Not necessarily, but it suggests Harris’s main department (scalability) raises the ceiling for these high-level offenses more than Kyrie Irving’s skills, which start to blend in after so much offensive talent is thrown into the mix.

    This is supported by single-year RAPM (Regularized Adjusted Plus/Minus). Most of the time, players like Durant (+2.17 ORAPM) and Irving (+2.37) are more valuable offensive players than Harris (+1.99), but the relatively small gap paired with our previous knowledge on the subject corroborates even more: once Brooklyn’s offense becomes astronomically good, using players’ scalable traits will raise the ceiling even more. This is antithetical to a player like Allen Iverson (AKA a “floor raiser”). But there’s still one unanswered question: why was James Harden seemingly a more valuable offensive player than Durant and Irving (but especially Durant). If Harden is the player being added to the preexisting roster, why doesn’t he experience many diminishing returns? The answer: load and role trade-offs.

    James Harden is comfortably the most ball-dominant of Brooklyn’s offensive stars, holding the ball for an average of 5.42 seconds per touch on 93.3 touches per game according to Synergy tracking data. Although there is a reduction from last season, as implied through the “portability” construct, this change wasn’t unexpected. Meanwhile, his teammates Durant and Irving clock in at 3.11 seconds per touch / 69.5 touches per game 4.44 seconds per touch / 75.1 touches per game, respectively. When Harden takes the load off Durant and Irving, he’s absorbing a significant amount of their offensive impact. So while Harden’s offensive impact didn’t change a whole lot, Durant’s and Irving’s did.

    “Portability” usually observes the “internal” changes, or how individuals fares in different environments, but the other half of that coin of how traits like ball-dominance affect the portability of teammates. These phenomena explain why Harden’s offensive impact is comparable to his role in Houston and why Joe Harris is arguably more valuable to extremely high-octane offenses than Kyrie Irving.

    So what about Griffin?

    A part of the beauty of interpreting the Blake Griffin trade is that, no matter how good he is with the Nets, his impact will become redundant. Whether he lets his injuries define his post-thirty era or transforms back into 2019 Blake Griffin, there’s simply a limited amount of offensive impact to go around. If Griffin were reminiscent of his early-2010s self, perhaps he’ll show notable ability to fit well alongside star talent; but based on his time with the Pistons, Griffin isn’t a very high-portability player. Thus, if I were Steve Nash and the Nets’ coaching staff, I wouldn’t slot Griffin into the starting lineup or into the lineup early on in the first quarter (because, contrary to popular belief, games are often won by building suitable leads in the first quarter). Instead, Griffin would better serve his purpose as an anchor of the second unit, depending on how good he is again because we still don’t have a very clear picture of that.

    Conclusively, regardless of the “goodness” Griffin brings to the table, he’ll be spending too much time alongside too many offensive superstars with too little defensive equity, and his value to the Nets won’t be especially significant given his minutes aren’t drastically staggered against the starters’ playing time. With all this information processed, there’s now a clearer picture as to where they stand in the current playoff picture. Given the trade-offs between Durant’s, Harden’s, and Irving’s offensive impact, we can’t expect Brooklyn’s offense to be that much better. (The loss of defensive shares in the Harden trade is why I still think Brooklyn would’ve been better off refraining.) Due to the unstable state of the team defense (looking to approach well-below-average), the team’s regular-season SRS will likely max out at +5, and I could see a top-three seed as perfectly reasonable – Brooklyn is still a very good team!

    And the Playoffs?

    During the postseason, Kevin Durant will have the same luxury he did with the Warriors: acting as the secondary offensive star. The stress taken of his load between OKC and Golden State explains a lot of the stat inflation during the 2017 and 2018 title runs, and thus, his scoring could thrive to a similar level. But then there’s Harden. As his load hasn’t changed too much, and his skills become more redundant in the second season, he’ll likely pose a similar threat compared to previous seasons (although the eased burden with more stars alongside him could open up more catch-and-shoot opportunities). Irving is just one more offensive threat to add to this equation and will continue to woo defenses away from overplaying one of the stars.

    The prospect of Brooklyn’s offense in the Playoffs is intriguing; however, the results we’ve seen so far make those ideas more of an “on paper” scenario. The applicability of this style has yet to materialize into firm action. The inevitable threat of facing above-average offenses will continue to deconstruct the Nets’ defense, and I don’t see a ton of evidence to suggest Brooklyn will notably improve from its +5 SRS caliber player during the regular season. Depending on how the Bucks and Sixers pan out in the second season, I could reasonably see the Nets in the NBA Finals, although this is more due to a subpar Eastern Conference than actual Finals-caliber play on their part. However, I’d really have to squint to see Brooklyn topple either of the healthy Los Angeles teams, and even teams like Phoenix would pose a legitimate threat.

    (? ClutchPoints)

    When all is said and done, I don’t expect to see the Nets lift the Larry O’Brien trophy. Based on the current landscape of the East, a Finals berth is not out of reason. Milwaukee and Philadelphia are legitimate threats, and although I favor the Nets over the 76ers, I think Milwaukee is entirely capable of pushing through. Based on my expectations for the Brooklyn Nets (+5 SRS), the odds they win the title would clock in at roughly 2.6%. But because the East is so depleted and I’m not 100% confident in that evaluation, my reasonable range for the Nets’ championship odds is between 3% and 7%. The lesson to preach: bet on the field.


  • How Do NBA Impact Metrics Work?

    How Do NBA Impact Metrics Work?

    The introductions of player-evaluation metrics like Player-Impact Plus/Minus (PIPM) and the “Luck-adjusted player estimate using a box prior regularized on-off” (yes, that is actually what “LEBRON” stands for) peddled the use of these metrics to a higher degree than ever. Nowadays, you’ll rarely see a comprehensive player analysis not include at least one type of impact metric. With a growing interest in advanced statistics in the communities with which I am involved, I figured it would serve as a useful topic to provide a more complete (compared with my previous attempts on the subject) and in-depth review of the mathematics and philosophies behind our favorite NBA numbers.

    To begin, let’s first start with an all-inclusive definition of what constitutes an impact metric:

    “Impact metrics” are all-in-one measurements that estimate a player’s value to his team. Within the context we’ll be diving into here, a player’s impact will be portrayed as his effect on his team’s point differential every 100 possessions he’s on the floor.

    As anyone who has ever tried to evaluate a basketball player knows, building a conclusive approach to sum all a player’s contributions in a single notation is nearly impossible, and it is. That’s a key I want to stress with impact metrics:

    Impact metrics are merely estimates of a player’s value to his team, not end-all-be-all values, that are subject to the deficiencies and confoundment of the metric’s methodologies and data set.

    However, what can be achieved is a “best guess” of sorts. We can use the “most likely” methods that will provide the most promising results. To represent this type of approach, I’ll go through a step-by-step process that is used to calculate one of the more popular impact metrics known today: Regularized Adjusted Plus-Minus, also known as “RAPM.” Like all impact metrics, it estimates the correlation between a player’s presence and his team’s performance, but the ideological and unique properties of its computations make it a building block upon which all other impact metrics rest.

    Traditional Plus/Minus

    When the NBA started tracking play-by-play data during the 1996-97 season, they calculated a statistic called “Plus/Minus,” which measured a team’s Net Rating (point differential every 100 possessions) while a given player was on the floor. For example, if Billy John played 800 possessions in a season during which his team held a cumulative point differential of 40 points, that player would have a Plus/Minus of +5. The “formula” for Plus/Minus is the point differential of the team while the given player was in the game divided by the number of possessions during which a player was on the floor (a “complete” possession has both an offensive and defensive action), extrapolated to 100 possessions.

    Example:

    • Billy John played 800 possessions through the season.
    • His team outscored its opponents by 40 points throughout those 800 possessions.

    Plus/Minus = [(Point Diff / Poss) * 100] = [(40/800) * 100] = +5

    While Plus/Minus is a complete and conclusive statistic, it suffers from severe forms of confoundment in a player-evaluation sense: 1) it doesn’t consider the players on the floor alongside the given player. If Zaza Pachulia had spent all his minutes alongside the Warriors mega-quartet during the 2017 season, he would likely have one of the best Plus/Minus scores in the league despite not being one of the best players in the league. The other half of this coin is the players used by the opposing team. If one player had spent all his time against that Warriors “death lineup,” then his Plus/Minus would have been abysmally-low even if he were one of the best players in the game (think of LeBron James with his depleted 2018 Cavaliers).

    Adjusted Plus/Minus

    “Adjusted” Plus/Minus (APM) was the first step in resolving these issues. The model worked to run through each individual stint (a series of possessions in which the same ten players are on the floor) and distribute the credit for the resulting team performances between the ten players. This process is achieved through the following framework:

    (? Squared Statistics)

    The system of linear equations is structured so “Y” equals the Net Rating of the home team in stint number “s” in a given game. The variables “A” and “B” are indicators of whether a given player is on the home or away team, respectively, while its first subscript (let’s call it “i”) categorizes a team’s player as a given number and the “s” (the second subscript) numbered stint in which the stint took place.

    To structure these equations to divvy the credit of the outcome of the stint, a player for the home team is designated with a 1, a player for the away team is given a -1, and a player on the bench is a 0 (because he played no role in the outcome of the stint).

    The matrix form of this system for a full game has the home team’s Net Rating for each stint listed on a column vector, which is then set equal to the “player” matrix, or the 1, -1, and 0 designation system we discussed earlier. Because the matrix will likely be non-square it is non-invertible (another indicator is that the determinant of the matrix would equal zero). Thus, the column vector and the player matrix are both multiplied by the transpose (meaning it is flipped across its diagonal, i.e. the rows become columns and the columns become rows) of the player matrix, which gives us a square matrix to solve for the implied beta column vector!

    An example of how a matrix is transposed.

    The new column vector will align the altered player matrix with the traditional Plus/Minus of a given player throughout the game while the new player matrix counts the number of interactions between two players. For example, if the value that intersects players one and six has an absolute value of eight, the two of them were on the floor together (or in this case, against each other) for eight stints. Unfortunately, the altered player matrix doesn’t have an inverse either, which requires the new column vector to be multiplied by the generalized inverse of the new player matrix (most commonly used as the Moore-Penrose inverse). I may take a deeper dive into computing the pseudoinverse of a non-invertible matrix in a future walk-through calculation, but the obligatory understanding of the technique for this example is that it’s an approximation of a given matrix with invertible properties.

    Multiplying by the “pseudoinverse” results in the approximation of the beta coefficients and will display the raw APM for the players in the game. Taken over the course of the season, a player’s APM is a weighted (by the number of possessions) average of a player’s scores for all games, and voila, Adjusted Plus/Minus! This process serves as the foundation for RAPM and, although a “fair” distribution of a team’s performance, it’s far from perfect. Raw APM is, admittedly, an unbiased measure, but it often suffers from extreme variance. This means the approximations (APM) from the model will often strongly correlate with a team’s performance, but as stated earlier, it’s a “best guess” measurement. Namely, if there were a set of solutions that would appease the least-squares regression even slightly less, the scores could drastically change.

    Thanks to the work of statisticians like Jeremias Engelmann (who, in a 2015 NESSIS talk, explained that regular APM will often “overfit,” meaning the model correlates too strongly to the measured response and loses significant predictive power, a main contributor to the variance problem), there are viable solutions to this confoundment.

    (? Towards Data Science)

    Regularized Adjusted Plus/Minus

    Former Senior Basketball Researcher for the Orlando Magic, Justin Jacobs, in his overview of the metric on Squared Statistics, outlined a set of calculations for APM in a three-on-three setting, obtaining features similar to the ones that would usually be found.

    (? Squared Statistics)

    Although the beta coefficients were perfectly reasonable estimators of a team’s Net Rating, their variances were astoundingly high. Statistically speaking, the likelihood that a given player’s APM score was truly reflective of his value to his team would be abysmal. To mitigate these hindrances, statisticians use a technique known as a “ridge regression,” which involves adding a very mild perturbation (“change”) to the player interaction matrix as another method to approximate the solutions that would have otherwise been found if the matrix were invertible.

    We start with the ordinary least-squares regression (this is the original and most commonly used method to estimate unknown parameters):

    This form is then altered as such:

    Note: The “beta-hat” indicates the solution is an approximation.

    The significant alterations to the OLS form are the additions of the lambda-value and an identity matrix (a square matrix with a “1” across its main diagonal and a “0” everywhere else; think of its usage as multiplying any number by one. Similar to how “n” (a number) * 1 = n, “I” (the identity matrix) * “A” (a matrix) = A). The trademark feature of the ridge regression is its shrinkage properties. The larger the lambda-value grows, the greater the penalty and the APM scores regress closer towards zero.

    (? UC Business Analytics – an example of shrinkage due to an increase in the lambda-value, represented by its (implied) base-10 logarithm)

    With the inclusion of the perturbation to the player interaction matrix, given the properties listed, we have RAPM! However, as with raw APM, there are multiple sources of confoundment. The most damning evidence, as stated earlier, is that we’re already using an approximation method, meaning the “most likely” style from APM isn’t eliminated with ridge regression. If the correlation to team success were slightly harmed, the beta coefficients could still see a change, but not one nearly as drastic as we’d see with regular APM.

    There’s also the minor inclusion of bias that is inherent with ridge regression. The bias-variance tradeoff is another trademark in regression analysis with its relationship between model complexity. Consequently, the goal will often be to find the “optimal” model complexity. RAPM is a model that introduces the aforementioned bias, but it’s such a small inclusion it’s nearly negligible. At the same time, we’re solving the variance problem! It’s also worth noting the lambda-value will affect the beta coefficients, meaning a player’s RAPM is best interpreted relative to the model’s lambda-value (another helpful tidbit from Justin Jacobs).

    (? Scott Fortmann-Roe)

    My concluding recommendations for interpreting RAPM include: 1) Allow the scores to have time to stabilize. Similar to points per game or win percentage, RAPM varies from game-to-game and, in its earlier stages, will often give a score that isn’t necessarily representative of a player’s value. 2) Low-minute players aren’t always properly measured either. This ties into the sample-size conundrum, but an important aspect of RAPM to consider is that it’s a “rate stat,” meaning it doesn’t account for the volume of a player’s minutes. Lastly, as emphasized throughout the calculation process, RAPM is not the exact correlation between the scoreboard and a player’s presence. Rather, it is an estimate. Given sufficient time to stabilize, it eventually gains a very high amount of descriptive power.

    Regression Models

    RAPM may be a helpful metric to use in a three or five-year sample, but what if we wanted to accomplish the same task (estimate a player’s impact on his team every 100 possessions he’s on the floor) with a smaller sample size? And how does all this relate to the metrics commonly used today, like Box Plus/Minus, PIPM, and LEBRON? As it turns out, they are the measurements that attempt to answer the question I proposed earlier: they will often replicate the scores (to the best of their abilities) that RAPM would distribute without the need for stabilization. Do they accomplish that? Sometimes. The sole reason for their existence is to approximate value in short stints, but that doesn’t necessarily mean they need some time to gain soundness.

    Similar to our exercise with a general impact metric, which uses any method to estimate value, let’s define the parameters of a “regression model” impact metric:

    A regression model is a type of impact metric that estimates RAPM over a shorter period of time than needed by RAPM (roughly three years) using a pool of explanatory variables that will vary from metric to metric.

    The idea is fairly clear: regression models estimate RAPM (hence, why scores are represented through net impact every 100 possessions). But how do they approximate those values? These types of impact metrics use a statistical technique named the multiple linear regression, which fulfills the goal of the regression model by estimating a “response” variable (in this case, RAPM) using a pool of explanatory variables. This will involve creating a model that takes observed response values (i.e. preexisting long-term RAPM) and its correlation with the independent variables used to describe the players (such as the box score, on-off ratings, etc.).

    (? Cross Validated – Stack Exchange)

    Similar to the “line of best fit” function in Google Sheets that creates forecast models for simple (using one explanatory variable) linear regressions, the multiple linear regression creates a line of best fit that considers descriptive power between multiple explanatory variables. Similar to the least-squares regression for APM, a regression model will usually approximate its response using ordinary least-squares, setting forth the same method present in the RAPM segment that is used to create the perturbation matrix. However, this isn’t always the case. Metrics like PIPM use a weighted linear regression (AKA weighted least squares) in which there is a preexisting knowledge of notable heteroscedasticity in the relationship between the model’s residuals and its predicted values (in rough layman’s terms, there is significant “variance” in the model’s variance).

    (The WLS format – describing the use of the residual and the value predicted from the model.)

    WLS is a subset of generalized least squares (in which there is a preexisting knowledge of homoscedasticity (there is little to no dispersion among the model’s variance) in the model), but the latter is rarely used to build impact metrics. Most metrics will follow the traditional path of designating two data sets: the training and validation data. The training data is used to fit the model (i.e. what is put into the regression) while the validation data evaluates parts like how biased the model is and assuring the lack of an overfit. If a model were trained to one set of data and not validated by another set, there’d be room to question its status as “good” unless verified at a later date.

    After the model is fitted and validated, an impact metric has been successfully created! Unfortunately (again…), we’re not done here, as another necessary part of understanding impact metrics is a working knowledge of how to assess their accuracy.

    Evaluating Regression Models

    While the formulations of a lot of these impact metrics may resemble one another, that doesn’t automatically mean similar methods produce similar outputs. Intuitively speaking, we’d expect a metric like PIPM or RAPTOR, which includes adjusted on-off ratings and tracking data, to have a higher descriptive power compared to a metric like BPM, which only uses the box score. Most of the time, our sixth sense can pick apart from the good from bad, and sometimes the good and the great, but simply skimming a metric’s leaderboard won’t suffice when evaluating the soundness of its model.

    The initial and one of the most common forms of assessing the fit of the model includes the output statistic “r-squared” (R^2), also known as the coefficient of determination. This measures the percent of variance that can be accounted for in a regression model. For example, if a BPM model has an R^2 of 0.70, then roughly 70% of the variance is accounted for while 30% is not. While this figure serves its purpose to measure the magnitude of the models’ fit to its response data, a higher R^2 isn’t necessarily “better” than a lower one. A model that is too reliant on its training data loses some of its predictive power, as stated earlier, falling victim to a model overfit. Thus, there are even more methods to assess the strength of these metrics.

    (? InvestingAnswers)

    Another common and very simple method could be to compare the absolute values of the residuals of the model’s scoring between the training data and the validation data (we use the absolute values because ordinary least-squares is designed so the sum of the residuals will equal zero) to assess whether the model is equally unbiased toward the data it isn’t fitted to. Although this may be a perfectly sound technique, its simplicity and lack of comprehension may leave the method at a higher risk of error. Its place here is more to provide a more intelligible outlook on evaluating regression models. Similarly, we’ll sometimes see the mean absolute error (MAE) of a model given with the regression details as a measure of how well it predicts those original sets of data.

    There’s also the statistical custom of assessing a metric’s residual plot, which compares the model’s predicted value and its residual (observed value minus predicted value) on the x and y-axes, respectively, on a two-dimensional Cartesian coordinate system (AKA a graph). If there is a distinct pattern found within the relationship between the two, the model is one of a poorer fit. The “ideal” models have a randomly distributed plot with values that don’t stray too far from a standardized-zero. Practically speaking, the evaluation of the residual plot is one of the common and viable methods to assessing how well the model was fit to the data.

    (? R-bloggers)

    However, as seen in works from websites like Nylon Calculus and Dunks & Threes, the most common form of impact metric evaluation in the analytics community is retrodiction testing. This involves using minute-weighted stats from one season used to predict the next season. For example, if Cornelius Featherton was worth +5.6 points every 100 possession he was on the floor during the 2019 season and played an average of 36 minutes per game in the 2020 season, his comparison score would equate to roughly +4.2 points per game. This would be used to measure the errors between a team’s cumulative score (i.e. an “estimated” SRS) against the team’s actual SRS. Evidently, this method suffers from the omission of ever-changing factors like a player’s improvements and declinations, aging curves, and yearly fluctuations, it does hold up against injury and serves a purpose as a measure of predictive power. (“A good stat is a predictive stat” – a spreading adage nowadays.)

    Basketball analytics and impact metrics may appear to be an esoteric field at times – I certainly thought so some time ago – but the comprehension of its methodologies and principles isn’t full of completely unintelligible metric designs and reviews. Hopefully, this post served as a good introductory framework to the models and philosophies of the numbers we adore as modern analysts or fans, and that it paints a somewhat clear picture of the meanings behind impact metrics.


  • The Psychology of Basketball (Part 2 – Dissecting Traditional Values)

    The Psychology of Basketball (Part 2 – Dissecting Traditional Values)

    Nowadays, you’re either an eye-test guy or stats guy, right? There seems to be no acceptable middle ground, especially to the side I’ll take a deep-dive into today, the “traditionalists.” The use of any intelligible statistic beyond the box score signals someone who skims a Basketball-Reference page to evaluate a player, a common notion set forth by some. I haven’t absorbed the entirety of the traditionalist standpoint; so, to gain insight on what it entails, I turned to Ekam Nagra, the face of the “Ball Don’t Stop” Instagram page, a platform he uses to host a podcast. He will often use his posts to share his ideas on how analytics are poor tools to evaluate players, at times to interview former and current NBA players with similar opinions.

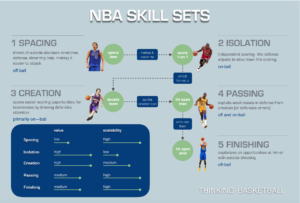
    Through my time spent learning the tendencies of his methods, I believe I’ve found a reasonable set of pillars that provide the structure for his evaluations, rankings, or any other process that requires player assessment:

    • Because the rules of basketball dictate the value of a possession to rely on whether or not the ball is scored, the most valuable individual trait is also scoring.
    • The previous view can be further defined to focus on volume scoring (although Nagra has expressed a distaste for the term in the past), with a crucial context of efficiency being the difficulty of the defensive scheming and the type of shot.
    • Defense, on the player and team levels, is less of an individual quality than offense because the latter dictates the momentum on the defensive end (offense “creates” defense in a way).
    • Statistics and analytics, in essence, lack context and are watered-down interpretations of court actions used as a flimsy replacement for “true” explanation.
    • Lastly, basketball analysis is an esoteric field. It requires direct, firsthand experience as a competitive basketball athlete to attain a higher ability to comprehend game actions.

    Anyone familiar with my previous work knows my evaluation tendencies, ones because of which Nagra would almost certainly dub me an “analytics boy” or a “stat fan.” I consistently use statistics and impact metrics in my end-of-season evaluations, so as a potential disclaimer, I am writing from a “progressive” perspective (i.e. in support of the analytics movement). Thus, I’ll dissect the meaning of Nagra’s explicit and implicit rationale to provide an analytical alternative, which will hopefully take the series an extra step further in the truer understanding of the psychology behind basketball.

    Scoring Blindness

    As I discussed in the first installment of the series, as defined by the Thinking Basketball book, “scoring blindness” is the tendency of a critic to overrate the contributions of a team’s highest-volume scorer (i.e. the player who leads his team in points per game). Although I don’t agree with the employment of such a method, I understand the concept behind it: if the point of a possession on offense is to score the basketball, then the best players will likely score most often. (This is something I generally agree with). However, Nagra takes it a step further in Episode 91 of the “Ball Don’t Stop” podcast, from which the following quote is derived:

    “… It just drives me crazy when I hear this, and I laugh, and it’s usually people that never played basketball saying this, or people that never really scored when they did play basketball, saying, ‘Oh, he’s just a scorer.’ … ‘You know, he’s the best scorer, he’s not the best player.’ … Scoring isn’t everything in basketball, but I’ll be the first to tell you it is by far the main thing. The name of the game is getting buckets.” (Ekam Nagra – Episode 91 of the “Ball Don’t Stop” podcast)

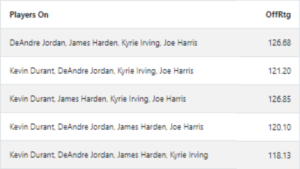
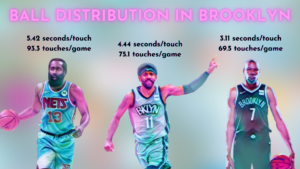
    I understand the train of thought behind Nagra’s beliefs. A team’s efficacy on offense is entirely dependent on how frequently they score the ball. This is why a team’s Offensive Rating is so widely used; it measures how good a team was at performing its offensive duties. Therefore, the “best” offensive players make the largest scoring contributions. However, I think it’s a misstep to connect scoring on the team level to individual scoring on the player level. This claim relies on the belief that individual scoring is not the only way to positively influence a team’s offense. High-level shot creation that unclogs the floor and opens more efficient attempts is, in fact, usually more effective to the team compared to consistent “hero-ball” and isolation possessions.

    Scoring blindness is, as stated earlier, the propensity to rate players based on favorable points per game figures, and we see it in practice with the criteria Nagra uses the evaluate players:

    “The number one thing in basketball, the foundation of the game is putting the ball in the basket. The guys that did that the best are the guys that shined the brightest in the history of the game. They’re the ones that moved arenas, they’re the ones that sold jerseys, they’re the ones put teams on their back, the guys that are, you know, making sh*t happen on the basketball court.” (Ekam Nagra – Episode 91 of the “Ball Don’t Stop” Podcast)

    I’ll return to the tendency later, but Nagra consistently attributes questionable factors to a player’s “goodness,” such as the roar of the crowd, merchandising, and a touch of the “Lone Star Illusion” (the tendency to undervalue the effects of a supporting cast, another topic invoked by Thinking Basketball). A self-proclaimed former player, Nagra often relates the demanding environment of the NBA to street-ball or pick-up preferences:

    “It’s… it’s simple, you know, common f*cking sense. If me and you were to walk into a court today and, er, open run or tryout or whatever, the first guy that would stand out, the first guy we’d look for if we were smart, is the guy that’s putting the ball in the hoop.” (Ekam Nagra – Episode 91 of the “Ball Don’t Stop” Podcast)

    This reminds me of the mentality of middle or high-school roster selection, or the mindset of the young players, which pose the ultimate goal to be the best and brightest scorer. After all, almost everyone wanted to be the ones to hit the game winners and the clutch shots when they were young, and that means you would want to become the best scorer. As I dive deeper into Nagra’s evaluation style, I’ve become more convinced a lot of his rationale is based on his time as a player: who stood out and who appeared to be the best.

    Nagra gives another opinion that provides insight on how he relates scoring to team performance later on in the episode used for the aforementioned quotes:

    “But those teams that win, and these teams that are led, and teams that go far in the Playoffs, they’re the ones that have the best scorer on the floor… or the second-best scorer on the floor… at all times.” (Ekam Nagra – Episode 91 of the “Ball Don’t Stop” podcast)

    Because he doesn’t give any specific examples, we could investigate this claim to create a “stepping-off” point to see whether or not his claims are based on facts or the internal, intuitive feelings he conveyed earlier in the episode. To either confirm or deny this claim, we can look at the league-leaders in points per game in recent history and connect them with which round their teams advanced to in the second season. (He doesn’t give a specific round or the number of postseason games played to constitute teams that “go far in the Playoffs,” so I’ll assume the lower fence is a conference championship appearance.)

    If a (qualified) top-two finisher in points per game was on a team that advanced to the conference championship or further in the same season, he will receive a “Yes.” If a player’s team did not manage to reach the semi-finals, he will be denoted with a “No.”

    • 2019-20: James Harden (No) and Bradley Beal (No)
    • 2018-19: James Harden (No) and Paul George (No)
    • 2017-18: James Harden (Yes) and Anthony Davis (No)
    • 2016-17: Russell Westbrook (No) and James Harden (No)
    • 2015-16: Stephen Curry (Yes) and James Harden (No)
    • 2014-15: Russell Westbrook (No) and James Harden (Yes)
    • 2013-14: Kevin Durant (Yes) and Carmelo Anthony (No)
    • 2012-13: Carmelo Anthony (No) and Kevin Durant (No)
    • 2011-12: Kevin Durant (Yes) and Kobe Bryant (No)
    • 2010-11: Kevin Durant (Yes) and LeBron James (Yes)
    • 2009-10: Kevin Durant (No) and LeBron James (No)
    • 2008-09: Dwyane Wade (No) and LeBron James (Yes)
    • 2007-08: LeBron James (No) and Allen Iverson (No)
    • 2006-07: Kobe Bryant (No) and Carmelo Anthony (No)
    • 2005-06: Kobe Bryant (No) and Allen Iverson (No)

    During the last fifteen seasons, only 26.7% of either conference final series has sported one of the top-two finishers in points per game in the same season. Admittedly, this isn’t the largest sample there is, but it disproves that having one of the top-two volume scorers in the league guarantees a deep Playoff run. We’ve actually seen more of the opposite; teams seem to be more likely to appear in the conference finals without, say, a thirty points per game scorer. This isn’t to say a team’s leading scorer hurts his team (although he sometimes does), but that a dominating half-court “assassin” is not a prerequisite to a deep run in the postseason.

    Defensive Ignorance

    With the current state of information available at the hands of most, there was bound to be a lopsided partiality to offense compared to defense. Box scores will track the number of points, rebounds, assists, field-goals, and turnovers a player records in a given period, but defense is restricted to steals and blocks (personal fouls are usually associated with the defensive box score but also include offensive fouls). Nagra is no exception to this tendency, expressing a clear opinion in Episode 34 of his podcast, which covered the validity of the terminology given to “two-way players.”

    He immediately provides insight on how he distinguishes the best players:

    “You know, the foundation of this game, since day-one, will always be scoring. The defense, all that other stuff is a bonus.” (Ekam Nagra – Episode 34 of the “Ball Don’t Stop” podcast)

    As discussed earlier, this relates to the connection Nagra established between scoring on the team level with individual scoring on the player level. We have already concluded this connection is mostly false and overlooks the larger expanse of offensive contributions that leads to scoring output among teams, so it’s safe to say this mindset is setting up all further opinions that build on this principle for some level of failure.

    However, it seems the prioritizing of high-volume scorer extends further than the structure of the game Nagra lays out:

    “The most feared thing in basketball, till this day, is a guy that can walk into a game and effortlessly get you thirty, forty, and fifty [points].” (Ekam Nagra – Episode 34 of the “Ball Don’t Stop” podcast)

    “I’ve never seen a coach break his clipboard because of two-way players just being a two-way player.” (Ekam Nagra – Episode 34 of the “Ball Don’t Stop” podcast)

    “You know, those are the guys [scorers] that people remember forever…” (Ekam Nagra – Episode 34 of the “Ball Don’t Stop” podcast)

    The common denominator of each sentiment is the reactivity to surroundings, especially emotionally-driven ones: fear, anger, and remembrance. Yet, Nagra uses these elements to evaluate on-court impact. The individual perceptions of these game actions may not even roughly correlate to value as a player, but he continually treats them otherwise. This relates to my earlier inferences that suggest Nagra structures his knowledge of basketball around his experiences as a player. However, as we explore later, having played basketball at even the highest level does not guarantee a higher ability to evaluate players.

    During the same segments, Nagra explores what he believes to be an inherent disparity between offensive and defensive contributions, the former of which drastically outweighs the latter:

    “Carmelo Anthony on the Knicks… top-four player in the game. You know, I didn’t care if he played defense or not. The fact that he could walk into a game and singlehandedly change the outcome, and… you know, have an impact on the game with just his scoring ability – that right there is it for me.” (Ekam Nagra – Episode 34 of the “Ball Don’t Stop” podcast)

    “Hey, if you’re a good defensive player, you’re a good defensive player. If you can score the hell out of the ball, you know, you’re a killer, you’re an assassin out there.” (Ekam Nagra – Episode 34 of the “Ball Don’t Stop” podcast)

    “You know, Michael Jordan and Kobe Bryant were the same way [skilled on offense and defense]. Like, I never saw anyone dub them as ‘two-way players.’ They were just the best players in the game… Them playing defense was a bonus.” (Ekam Nagra – Episode 34 of the “Ball Don’t Stop” podcast)

    Defense is consistently treated as a secondary trait, a bonus, to offense. Nagra suggested no other skill in basketball matters if, at the end of the day, the ball wasn’t going in the basket. He doesn’t hold this to be self-evident; rather, the rules of basketball (which require a bucket to be had) make it so. This is more antithetical to how basketball is played than Nagra gives credit for. Through the entirety of his segments that cover scoring or defense, he doesn’t address that the magnitude of a two-point basket on offense is equal to that of a two-point basket allowed on defense. If the world’s greatest offensive player is worth 1.3 points per team possession but allows 1.3 points per possession on defense, he’s not helping his team win at all!

    “Correctness”

    The last revealing quotation from Episode 34 comes with his disagreement on the soundness of dubbing “two-way” play:

    “What the f*ck is a two-way player? Like, who came up with this concept? You know, if you look back at it, like… I never heard this in the ‘90s. I never heard this in the 2000s.” (Ekam Nagra – Episode 34 of the “Ball Don’t Stop” podcast)

    Nagra displays a clear bias toward styles of basketball that align with the styles of play that were most prevalent in his youthhood, with a strong emphasis on jump shots. During Episode 36, he provides this excerpt on a tendency he observed upon LeBron James’s arrival in Miami:

    “I didn’t like it when he [LeBron James] went to the Miami Heat and he was like, ‘Hey, I’m not gonna shoot threes anymore; or, I’m gonna shoot less jumpers.’ … I didn’t feel like that was pure. You know, you can’t really cheat the game. You can’t be… like, it is what it is. You gotta make jump shots. In basketball, the foundation is ‘get a bucket,’ score a jump shot, all these things. You know, they matter.” (Ekam Nagra – Episode 36 of the “Ball Don’t Stop” podcast)

    During his discussion on why he believed Kawhi Leonard was the second-best player in basketball, Nagra heavily implies a “proper” or “correct” version of basketball exists that some of the league’s players have violated. He, again, refers to his foundation of the game (to get a bucket), the misinterpretation of which already dilutes the quality of any appendages, but then extends it to: “You gotta make jump shots.” To improve the team’s offense, it would be undeniably more effective for the unit to score fifty-five easy layups (if those were somehow available) than to score thirty, forty, or even fifty-four of the most difficult mid-range shots in league history. After all, the team that scores the most wins!

    Nagra’s inclinations toward his most prized styles of play signal heavy biases, and ones that cloud the truth behind “effective” basketball play as ones that are flashy, memorable, and visually remarkable. Thus, I don’t immediately absorb the opinions he states as ones of proper consideration, rather ones driven by personal preferences that don’t relate to the “true” topic at hand, which makes these claims nothing more than opinions in a sea of truth and falsehood.

    We’ll fast-forward to Episode 211 of the Ball Don’t Stop podcast, in which Nagra an All-Rookie and All-Defensive former NBA player in Josh Smith. When Nagra asks Smith what the latter’s reaction was upon the arrival of the analytics revolution, Smith replies with:

    “It [the analytics revolution] felt weird because… you know, when you start playing basketball, you’re taught the game the right way. You know, like, you know, mid-range, layups, three-pointers, you know, like… getting your teammates the ball… You gotta start inside out.” (Josh Smith – Episode 211 of the “Ball Don’t Stop” podcast)

    There’s a recurring theme in the “Ball Don’t Stop” podcasts that distinguish a “proper” way to play the game, one that paves the way for Nagra’s (and former players alike) distaste of basketball analytics and advanced statistics.

    Authority

    Among the pillars of traditional values stated earlier was the extreme value of having experienced the competitive and rigorous environment of professional or semi-professional basketball play. If such a trait doesn’t reside within the individual, he or she is automatically less able to discuss the evaluations of a player at a higher level.

    During Episode 211, he interviews an All-Rookie and All-Defensive former NBA player in Josh Smith. Nagra wastes no time in expressing disinterest in the analytics revolution and modernized statistics:

    “I feel like the game now, as talented as it is, as athletic as it is, they’ve [analytics and its supporters] kind of dumbed it down, the way it’s played, man; and like, it’s just weird to me.” (Ekam Nagra – Episode 211 of the “Ball Don’t Stop podcast)

    As we’ll explore later, Nagra sees the analytics revolution and its associated forthcoming as having deteriorated the play of the game, crucial context for later excerpts. Smith follows later in the episode with his own take on how players approach analytics:

    “As a player, how can you listen to a person that never played the game of basketball? ‘Cause most of those analytical guys… have never played a game of basketball, so they don’t have a feel of… what’s really going on… and time and situation and… the mental aspect of the game… You can’t put that in the analytics.” (Josh Smith – Episode 211 of the “Ball Don’t Stop” podcast)

    Smith certainly doesn’t speak for all players, especially the recently-employed more familiar with the analytical setting (Smith played his last full season in 2015-16), but there seems to be some notable stigma towards the analytics departments of NBA teams among players. They feel, as few to none of the analysts were players themselves, the analysts are not as qualified to dictate the tendencies and playstyles of those that are or were experienced as NBA players. Smith said that the lack of hands-on experience prohibited analytics developers from comprehending and incorporating the necessary elements.

    I’ve never played in the NBA, so perhaps there’s something that I’m missing, but no matter who you are or what your experience with basketball is, the exact same forty-eight minutes of play (barring overtime) is available to any and all who can watch. At the end of the day, all of the court actions that a player is involved in can be absorbed by an outside observer. Granted, the comprehension of these court actions is a skill, and one that requires great knowledge and practice; but the only aspect of the game that a non-player can’t directly recognize is the “mental” aspect: what flows through the players’ minds. The ability to experience these may add context to the triggers behind varying neurological patterns in certain moments; but as Nagra continuously states, victory is crowned by scoring more than the opponent. No aspect of a player’s impact is exclusive to former or current players.

    As Nagra and Smith continue their conversation, the latter gives more of his thoughts on how analytics is changing the game and, more specifically, how it affects the NBA as a show business:

    “It’s sad, because… I feel like it’s gonna eventually take… the ratings are gonna start going down because… like, the exciting part of the game was dunking on motherf*ckers… like, putting that sh*t in the rim, putting they *ss in the rim… It’s like, all these threes and layups and floaters and sh*t… It’s taking the excitement out of the game.” (Josh Smith – Episode 211 of the “Ball Don’t Stop” podcast)

    Smith clearly connects his distaste of analytics to how it affects the style of the game, an aspect for which Nagra also expressed concern. It’s not unreasonable to say that the pace-and-space style of basketball spurred by analytics makes the viewing experience less exciting, but then again, analytics were not created to improve game ratings. Analytics were created to give players and teams the highest odds to win. Advanced statistics and impact metrics aim to quantify and structure a player’s or team’s impact, not either’s likelihood of increasing viewer count. Thus, I see Nagra and Smith’s concern with analytics as not only misguided but untrue to the nature of its creation. Advanced statistics are not boosters of the NBA as a show business; they aim to provide explanatory and predictive power to help players and teams understand what happens on the court and to improve for the future.

    I went into this examination of “traditional” thinking with an open mind, even hoping to add a piece or two of its process to my own if I were to find the right evidence. Unfortunately, I don’t feel I’ve been given any more reason to revert to traditionalism given the alternatives (i.e. analytics). Nagra does not speak for all traditionalists and Smith doesn’t speak for all players, but the brief taste I had of their ideologies was nothing more than unimpressive. They aspire for a desirable style of play that, along with the growth of data and information, became obsolete. Now, there’s certainly nothing wrong with deprecating the current style of play as it pertains to the watching experience, but the same practice in evaluating players and teams is a method doomed for failure.

    Nagra peddles the belief that experience, or the lack thereof, is the problem in today’s game. To me, it’s less an issue stemming from experience, but the unrelenting tendency to hold onto ideals and the inability to adapt to an evolving game.


  • The Top 25 NBA Players of 2020 – A Remastered List (Part 2 #6-15)

    The Top 25 NBA Players of 2020 – A Remastered List (Part 2 #6-15)

    I’ve had more discussions on how to properly evaluate basketball players more times than I can count. More often than not, I’ve been met with disagreement in those conversations. After a very recent one that argued the very principles and measurements that govern and quantify certain skills, I was inspired to “remaster” my player rankings list from 2020. The recent acquisition of some proprietary data from BBall Index was the perfect opportunity to use new and refreshing information to increase the accuracy of my evaluations, and I’d like to share the results here.

    Criteria

    It’s very easy to skip a “criteria” section in a player ranking and go directly to the list, but such segments are the perfect indicators for why certain players appear in the spots they occupy. Therefore, if I receive any comments along the lines of: “Why is [insert player name] ranked so low? He averaged this many points, rebounds, and assists with this field-goal percentage, and his team record was this!” I will probably not respond. After all, this is not a list of which players have the sexiest box scores or which players’ teams were the best. The former merely quantifies tendencies and the latter is unrelated to individual performance as a whole, so they aren’t devices I’m particularly comfortable using.

    I’ve repeated my evaluation process in almost every post that pertains to the subject, and this one will be no exception. I follow a simple train of logic that, while not necessarily being an axiom of the process, is the “most likely” truth I’ve come across: 1) basketball is a team sport, and players are chosen to help improve the success of the team, 2) over the course of a whole season (the length of a “seasonal” evaluation), the ultimate team goal is to win the Finals, 3) therefore, the best players increase the likelihood of a championship the most. That chain of thought is often confused with prioritizing players whose teams performed the best or were the closest to winning a title in a given year. This is not the case. Players are seen as independent from their teams in these evaluations.

    Namely, “situational” value is not the target of this ranking due to significant levels of confoundment for certain players (i.e. certain team constructions can dilute the “true” value of a player). Rather, these evaluations consider how a player would affect all types of teams, ranging from the worst to the best ever and everything in between. To measure the championship likelihood a player provides, I estimate a player’s per-game impact alongside average teammates in a theoretically “average” system (metrics like Adjusted Plus/Minus capture the “most likely” value of this). However, this “true” APM value changes as a player enters a new environment. As the team quality falls below an SRS of 0, the player becomes more important (thus, his “true” APM rises) and, inversely, as the team’s SRS exceeds 0, the player becomes less and less important. The deceleration of the latter is measured through “portability,” which uses five scaling curves to estimate the degree to which these diminishing returns occur.

    To recap:

    • I translate all my thoughts on a player to a numerical scale that estimates a player’s “true” Adjusted Plus/Minus, or per-game impact alongside average teammates and against average opponents.
    • Portability ratings then measure the changes in “true” APM (which I call “Plus/Minus Rating,” or “PMR”) to estimate how a player impacts the more extreme team qualities.
    • The team SRS with versus without the player and how it translates to championship equity is determined using a function, based on historical data, that estimates title odds.
    • The weighted (for how likely a player would be on a given team) average of championship odds with and without a player is his Championship Probability Added (“CPA”) value.

    Note: The distribution of team SRS is based on the last fifty seasons of team data / Portability is more of a spectrum than anything else, so if two or more players have the same CPA value, I opt for which one is more scalable, even if the two happen to be assigned to the same scaling curve.

    With the criteria portion out of the way, let’s get into the juicier content: the rankings themselves. Earlier today, I kicked off the series with the #16 to #25 players, which is followed here with a separate post for the #6 to #15 players and will conclude with the top-five. Let’s dive in!

    HMs (include but are not limited to): De’Aaron Fox and Donovan Mitchell

    25. Bradley Beal

    24. Pascal Siakam

    23. Kyle Lowry

    22. Devin Booker

    21. Bam Adebayo

    20. Kemba Walker

    19. Jrue Holiday

    18. Chris Paul

    17. Jayson Tatum

    16. Khris Middleton

    15. Karl-Anthony Towns (C)

    Towns is blossoming into one of the sport’s greatest offensive big men ever right before our eyes. His outstanding outside shooting and scoring gravity have made him one of the most effective weapons at his position, and strong isolationism and finishing bolster the quality of his skill set. Towns is one of the league’s more troubled defenders; he has yet to get a groove on that front. He’s an effective interior defender at times, and he guarded fairly difficult opponents, but a lack of intensive engagement is the defining aspect of his defense.

    Championship Probability Added: 4.4%

    14. Paul George, Clippers (SF)

    It’s entirely fair to say Paul George was one of the least improved players in 2020, but the drop wasn’t quite enough for me to remove him from bordering superstar territory. He is still one of the most efficient and gravitational three-point shooters in the league with effective off-ball movement and surprisingly good playmaking as a secondary star in Los Angeles. He took a step back on defense with less activity in passing lanes compared to 2019, and his paint presence was nothing to marvel about, but I still saw George as a large plus defensively.

    Championship Probability Added: 4.6%

    13. Rudy Gobert, Jazz (C)

    The “Stifle Tower” isn’t the hot topic he was after winning two consecutive Defensive Player of the Year Awards, and rightfully so in a way. Recent data has suggested non-versatile big men who stick in the paint lose value in the Playoffs, and Gobert was no exception. However, the remnants of his defense, and especially his all-time level interior play, led me to believe he remained basketball’s best defender. Gobert would deter shots at the rim, he would prevent the potential points (he was in the 100th percentile in adjusted points saved at the rim per 36 minutes), and he would block shots more effectively than nearly any player in the league.

    Championship Probability Added: 4.8%

    12. Kyrie Irving, Nets (PG)

    Although he only played 20 games in the regular season and none of the Nets’ playoff games, Irving was still one of the top-four point guards in the league at full health. He was as good as he’d ever been offensively, displaying mastery in distance shooting, isolation, finishing, and creation. Irving is one of the rare engines who could quarterback a very good offense, and because he was in the 97th percentile in high-value assists per 75 possessions, I saw more to suggest Irving, despite all of his off-court issues, was one of the most impactful basketball players in the league.

    Championship Probability Added: 5.0%

    11. Jimmy Butler, Heat (SF)

    Jimmy Buckets blew my expectations out of the water in 2020. He’s known for having led Miami to an unexpected Finals berth, but the skill of his that stood out to me was his off-ball capabilities, which were among the very best in the league. Butler was in the 93rd percentile in points generated on cuts and shots off screens relative to league efficiency and covered a lot more ground than a lot of players with similar roles. He was also in the 98th percentile in matchup difficulty and the 99th and 98th percentile in position and role versatility on that end, which measure the diversity of the number of positions and offensive archetypes he guarded, respectively.

    Championship Probability Added: 5.3%

    10. Damian Lillard, Trail Blazers (PG)

    Lillard entered rarified air as an offensive player in the bubble, and a lot of it seemed to be clear, tangible improvement. He captivated fans en route to a “Bubble MVP” with his three-point logo shots (after all, he was in the 93rd percentile in average three-point shot distance). Lillard remained one of the sport’s very best isolation scorers, drivers, and playmakers. His passing was very versatile but not necessarily efficient, although this deficiency was compensated with top-tier creation and scoring gravity. Lillard’s defense was the weakness in his campaign, but it doesn’t drag him down any further than tenth on my list.

    Championship Probability Added: 6.7%

    9. Joel Embiid, 76ers (C)

    Joel Embiid doesn’t exactly fit the developing skills of the pace-and-space league of today, but his post play and interior defense make him one of the most valuable centers in the game. He was in the 99th percentile in both isolation attempts and impact per 75 possessions, the latter of which uses league-average efficiency as a baseline. Embiid also guarded some of the most difficult matchups in the league, ranking in the 95th and 88th percentiles in time spent guarding All-Star and All-NBA players, respectively. Although he didn’t have the outside shooting or perimeter defense to become a well-rounded superstar, the skill set he had ranked among the league’s very best.

    Championship Probability Added: 6.9%

    8. Luka Dončić, Mavericks (PG)

    The Slovenian wunderkind had one of the greatest seasons from a 20-year-old in the history of basketball. Dončić evolved into one of the league’s greatest finishers and passers, the latter of which was the primary reason for his offensive explosion. He was one of the most efficient and versatile passers in basketball, led the league in Box Creation, and received BBall Index‘s highest grade in playmaking not given to a player named LeBron James. The strong point of his offensive portfolio was how it cultivated the most efficient team offense in the history of the NBA. Granted, some of it was due to a recent offensive burst in the past few seasons, but Dončić has one of the brightest futures in the league as an offensive superstar.

    Championship Probability Added: 7.8%

    7. Nikola Jokić, Nuggets (C)

    Similar to his fellow European predecessor on this list, Nikola Jokić is one of the brightest stars in the NBA’s next wave of playmaking superstars. Despite his position, Jokić made a strong case as the very best passer in basketball, rivaling Dončić and the Finals MVP, LeBron James. He was also undervalued as an isolationist, ranking in the 95th percentile in frequency and the 88th in effective field-goal percentage on such possessions. Jokić used his burly frame to his advantage, playing a unique form of bully ball that allowed him to place in the 85th percentile in adjusted (for frequency) field-goal percentage at the rim. I couldn’t help but not view his defense as anything but a slight positive, as he was active in the interior with some of the league’s smoothest hands. Jokić is on the cusp of superstar play.

    Championship Probability Added: 8.5%

    6. James Harden, Rockets (SG)

    I’m not sure the “reasonable” range in which I could see Harden will ever change. He always seems to be in his own territory due to extremely impactful offensive play with a diverse skill set but the limited scalability and unnerving ball dominance to push him up among the league’s megastars. Regardless of which tier he falls under, it’s hard to deny he’s mastered nearly every skill on the offensive end: shooting, finishing, passing, creation, and foul (baiting) drawing. Harden’s skills, admittedly, don’t translate to the playoffs as well as others, but the degree to which it does is far less strenuous than most will suggest. Aside from strength in the post with moderate effectiveness on shot contests on the perimeter, his defense is a very mild negative to me. Because he plays in a time with so much star talent, it’s easy to overlook Harden now, but his performances will be marveled upon in the following decades.

    Championship Probability Added: 10.0%

    Stay tuned for the final installment on the series, which ranks the top-five players of the 2020 season, coming soon!


  • The Top 25 NBA Players of 2020 – A Remastered List (Part 1 #16-25)

    The Top 25 NBA Players of 2020 – A Remastered List (Part 1 #16-25)

    I’ve had more discussions on how to properly evaluate basketball players more times than I can count. More often than not, I’ve been met with disagreement in those conversations. After a very recent one that argued the very principles and measurements that govern and quantify certain skills, I was inspired to “remaster” my player rankings list from 2020. The recent acquisition of some proprietary data from BBall Index was the perfect opportunity to use new and refreshing information to increase the accuracy of my evaluations, and I’d like to share the results here.

    Criteria

    It’s very easy to skip a “criteria” section in a player ranking and go directly to the list, but such segments are the perfect indicators for why certain players appear in the spots they occupy. Therefore, if I receive any comments along the lines of: “Why is [insert player name] ranked so low? He averaged this many points, rebounds, and assists with this field-goal percentage, and his team record was this!” I will probably not respond. After all, this is not a list of which players have the sexiest box scores or which players’ teams were the best. The former merely quantifies tendencies and the latter is unrelated to individual performance as a whole, so they aren’t devices I’m particularly comfortable using.

    I’ve repeated my evaluation process in almost every post that pertains to the subject, and this one will be no exception. I follow a simple train of logic that, while not necessarily being an axiom of the process, is the “most likely” truth I’ve come across: 1) basketball is a team sport, and players are chosen to help improve the success of the team, 2) over the course of a whole season (the length of a “seasonal” evaluation), the ultimate team goal is to win the Finals, 3) therefore, the best players increase the likelihood of a championship the most. That chain of thought is often confused with prioritizing players whose teams performed the best or were the closest to winning a title in a given year. This is not the case. Players are seen as independent from their teams in these evaluations.

    Namely, “situational” value is not the target of this ranking due to significant levels of confoundment for certain players (i.e. certain team constructions can dilute the “true” value of a player). Rather, these evaluations consider how a player would affect all types of teams, ranging from the worst to the best ever and everything in between. To measure the championship likelihood a player provides, I estimate a player’s per-game impact alongside average teammates in a theoretically “average” system (metrics like Adjusted Plus/Minus capture the “most likely” value of this). However, this “true” APM value changes as a player enters a new environment. As the team quality falls below an SRS of 0, the player becomes more important (thus, his “true” APM rises) and, inversely, as the team’s SRS exceeds 0, the player becomes less and less important. The deceleration of the latter is measured through “portability,” which uses five scaling curves to estimate the degree to which these diminishing returns occur.

    To recap:

    • I translate all my thoughts on a player to a numerical scale that estimates a player’s “true” Adjusted Plus/Minus, or per-game impact alongside average teammates and against average opponents.
    • Portability ratings then measure the changes in “true” APM (which I call “Plus/Minus Rating,” or “PMR”) to estimate how a player impacts the more extreme team qualities.
    • The team SRS with versus without the player and how it translates to championship equity is determined using a function, based on historical data, that estimates title odds.
    • The weighted (for how likely a player would be on a given team) average of championship odds with and without a player is his Championship Probability Added (“CPA”) value.

    Note: The distribution of team SRS is based on the last fifty seasons of team data / Portability is more of a spectrum than anything else, so if two or more players have the same CPA value, I opt for which one is more scalable, even if the two happen to be assigned to the same scaling curve.

    With the criteria portion out of the way, let’s get into the juicier content: the rankings themselves. Today, I’ll kick off the series with the #16 to #25 players, which will be followed with a separate post for the #6 to #15 players and will conclude with the top-five. Let’s dive in!

    The “just missed the cut” bunch, or players within half of a percent of making the list, includes but is not limited to De’Aaron Fox (2.1%) and Donovan Mitchell (2.1%).

    25. Bradley Beal, Wizards (SG)

    Although most saw his season highlighted by an outstanding 30.5 points per game, Beal’s real talent was his increasing scalability. The impact he provided off the ball, in screen action on the perimeter, and improved passing efficiency were the true upgrades to his offensive skill set. He lagged behind on this list due to a troubled defensive game, but its offensive counterpart mitigated any extreme effects.

    Championship Probability Added: 2.5%

    24. Pascal Siakam, Raptors (PF)

    “Spicy P” was edging into a lot of people’s top-ten rankings approaching the end of the season due to leading the number-two seed in the East in scoring. However, similar to Beal, the traits Siakam exhibited that I valued more were his “portable” ones: extremely versatile defense (he guarded each one of the five positions during at least 13.9% of his possessions) and stronger movement off the ball. I attribute the changes in his postseason box score to an extreme matchup more than most.

    Championship Probability Added: 2.7%

    23. Kyle Lowry, Raptors (PG)

    Lowry has always been a great option for Toronto on the perimeter, whether it be on the offensive or defensive side of the ball. He paired extremely strong playmaking and offensive screen action with active and attentive perimeter defense that captured the scrappy nature of his play. Lowry has yet to break through on either side of the ball to vault him into strong All-NBA candidacy, but the aggregate effects of his two-way play earn him a well-deserved ranking.

    Championship Probability Added: 2.7%

    22. Devin Booker, Suns (SG)

    Devin Booker may be the most undervalued offensive engine to be drafted in the past six seasons. He’s developing into a master of nearly every offensive skill: scoring, shooting, passing, creation, off-ball movement, and even some post play. His 2020 campaign a more promising signal of his future than most will recognize. If his defense were only more effective, he would enter All-NBA territory right now. For now, he’s a strong All-Star level player.

    Championship Probability Added: 2.7%

    21. Bam Adebayo, Heat (PF)

    He may not have the spicy scoring average or captivating outside shooting to woo fans like a lot of the on-ball engines on this list, Adebayo more than makes up for it with his strong secondary traits and game-changing defense. He was the Robin to Jimmy Butler’s Batman in Miami’s surprisingly good offensive scheme last season, and his finishing and rim rolling capabilities were perfect complementary skills to Butler’s playmaking.

    Championship Probability Added: 2.9%

    20. Kemba Walker, Celtics (PG)

    After a strong offensive season in Charlotte, Walker made the unexpected transition to secondary star behind Jayson Tatum, but my best guess is that he was still the best offensive player on the team: more refined scoring, passing, and he provided a much-needed boost to convert Boston from an up-and-coming band to one of the league’s highest-performing offenses. Walker was not quite a top-ten offensive player in my eyes, but a diverse portfolio of defensive matchups and mild effectiveness earns him a top-twenty nod for me.

    Championship Probability Added: 3.3%

    19. Jrue Holiday, Pelicans (SG)

    Holiday may seem to have been dwarfed under the rookie sensation that was Zion Williamson or the All-Star appearance of Brandon Ingram, but he was the clear driver of the New Orleans squad. He led the team in Box Creation and was a close second in offensive load to Ingram. The more impressive note on Holiday’s game to me is his sneaky good isolationism; he was in the 90th percentile in effective field-goal percentage on such possessions, which paired with exceptional passing and playmaking, enabled Holiday to act as one of the exclusive offensive engines in the NBA.

    Championship Probability Added: 3.3%

    18. Chris Paul, Thunder (PG)

    Previously seen to be approaching the dusk of a luxurious NBA career, Paul sparked some life in his aging game by regaining status as a premier passer and playmaker and some of the most effective outside shooting in the league. His lack of efficacy off the ball and declining defense lead me to believe he was best suited as a number-one option, but this likely means none of his offenses would have ever eclipsed into greatness. Perhaps his stint with James Harden contests that, but I view Paul as a fairly neutral defender with strong offensive quarterbacking abilities.

    Championship Probability Added: 3.6%

    17. Jayson Tatum, Celtics (PF)

    It wasn’t uncommon to see critics view Tatum as on the verge of a breakout season, and he finally materialized the possibility in 2020. A refined selection of shots that placed less emphasis on long twos was a crucial addition to his game; and, although his efficiency was less than league-average last year, an exceptional outside shooting portfolio, a strong one-on-one skill set, and developing finishing abilities signals promise. Tatum’s extreme versatility and perimeter engagement on the defensive end led to an All-NBA level season.

    Championship Probability Added: 4.0%

    16. Khris Middleton, SF (MIL)

    Giannis Antetokounmpo’s partner in crime blossomed into one of the league’s most effective secondary options in 2020. He exhibited one of the best outside shooting campaigns of the year and, alongside his developing passing game and strong gravity, evolved into one of the very best offensive players in the sport. His defense was also a large positive. Middleton wasn’t the most active defender in the world, but he was among the most disruptive in the league and prohibited shots at the rim as well as any wing in the league.

    Championship Probability Added: 4.3%

    Stay tuned for the next two additions to the series, which will be released in the next few days!


  • The Psychology of Basketball (Part 1 – Scoring Blindness and Variance)

    The Psychology of Basketball (Part 1 – Scoring Blindness and Variance)

    Basketball is one of the most divisive sports in how its followers interpret the actions and results of the games. Enough of a mixture of ambiguity and clarity exists that allows viewers to, depending on their psychological tendencies, to either hold very assured or very doubtful opinions. Although the following is not a trend of any large population, in my own experience, I’ve frequently felt less confidence in my assertions as the quality of my research on a particular topic increases. This isn’t a knock on any type of analytical method; rather, over time, as I’ve learned more and more as to what information is worthwhile and which conventions aren’t, the insurmountable number of hindrances that prevent “correct” conclusions becomes more and more obvious. That’s why, without a proper framework to assess certain aspects of the game, a lot of the givens and guarantees set forth by critics and fans are doomed for failure.

    Thinking Basketball was an invaluable read that does justice to its description: “a guide to being a responsible fan.” I was already acquainted with a lot of the concepts discussed in the book, yet it was nothing short of an eye-opening experience. It provides value from a psychological perspective, having been written by Ben Taylor, a cognitive scientist in addition to an NBA analyst. The self-proclaimed subtitle of the novel, per Taylor’s website, Backpicks, stresses “‘…Why our minds need help making sense of complexity.’” A foundational idea in the book is how the human brain is unable to properly categorize and store the hundreds of thousands of court actions from the tens of thousands of possessions that occur in an NBA season, and how negligence of that paves the way for a multitude of unconscious biases and misconceptions that dominate commercial and media analysis. 

    This is a large reason for my skepticism of heavily eye-testing games. Unless the viewer is able to watch every single one of a player’s possessions over the course of a season, a lot of that “mental extrapolation” doesn’t act as a very representative picture of a player’s tendencies. Even if someone managed to watch every single possession, they’d also have to overcome faulty memory, which would require an extremely diligent note keeping system. Not even that guarantees “correct” representation, as the viewer needs to also be able to identify the causal actions of a play rather than the outcome alone, a skill that is surprisingly rare.

    The concluding sentence of the previous paragraph is very significant in my emphasizing how important Thinking Basketball and its ideas are. The large majority (an understatement) of critics and fans are not aware of the biases and misconceptions that riddle their inferences, thus hindering the growth of these principles. I’ll return to the possibility of what may be the necessity for the continuation of the incorporation of these obstructions later, but on an individual level, the absorption of the techniques presented in the book will work wonders for the unexpecting reader. I’ll discuss the fallacies introduced by Taylor that pertain to certain examples I’ve encountered to, hopefully, give reason to purchase Thinking Basketball and consider its contents.

    Scoring Blindness

    It’s no secret the mass usually sees the “best” players as the best scorers. After all, if the player is managing to put the ball in the basket, he’s probably doing something right. This is hardly the case. Without delving too deep into the phenomenon that is “scoring blindness,” it’s simply the widespread propensity to overrate the effects of “individual scoring,” measured by statistics such as points per game and scoring rate. This causes a player who provides significant value in other aspects, such as creation and defense, to be disproportionally valued against the leading scorer on the same team, who might actually be hurting the offense’s efficiency depending on the circumstances.

    The perfect modern example of how “scoring blindness” influences opinions lies in the current Utah Jazz, a team that features an ostensible race to be named the team’s best player between All-Stars Rudy Gobert and Donovan Mitchell. Any fan who’s paid even minor attention to the league in the past three years knows Gobert as the defensive titan who anchors Utah’s annually good team defenses and Mitchell as the volume scorer who acts as the Jazz’s offensive commander. Last week, I issued a poll on Hardwood Amino that simply asked the voter to choose which player they thought was the “best” in Utah between Mike Conley (an outside candidate), Gobert, and Mitchell. With 197 votes tallied, here are the results at the time of this writing:

    The application allows the user who issues the poll to vote, which is needed to view the results. The green check denotes the player for whom I voted.

    Even with my extra vote for Gobert, nearly sixty percent of participants saw Mitchell as the best player on the Jazz. This doesn’t necessarily mean the same proportion of the population feels the same way, but perhaps this signals the potential trend that would be in favor of Mitchell. I was able to gain insight from a “Mitchell supporter,” @paydaypayton (whom I’ll refer to as “Payton”) on Discuss TheGame, in an earlier discussion. A portion of his argument in favor of Mitchell relies on the following viewpoint:

    “But we [are] really forgetting that Mitchell has been basically single-handedly the reason why the Jazz have had any success in the postseason…”

    Payton may reminisce on this statement as a hyperbolic response, but let’s explore the possibility of Mitchell as, at the very least, the primary driver of Utah’s success in the postseason. Measurements I lean towards as painting a strong picture of a player’s per-individual-possession value to his team is the Oliver Rating System, typically referred to as Offensive and Defensive Ratings, which estimate the number of points a player produces and permits on either side of the ball per 100 individual possessions. Because no player is involved in 100 team possessions a game, these ratings can seem outlandish, but are, in fact, great estimates on the basis it uses – individual possessions. 

    The portrayals of either player from Oliver’s ratings, which I happen to agree with, are that the very different styles of offense they play generate different results. Gobert, due to a healthy 78% of his field-goal attempts in the Playoffs coming within three feet of the rim, a high frequency of offensive rebounding, and low-risk offensive possessions, generates considerably more points per individual possession than most players (this is a large reason for Oliver’s emphasis on roles when using his ratings). Thus, it’s not abnormal to see his marks in this stat remain higher than Mitchell’s quite often. Truth be told, he generated more points per individual possession in every one of the Jazz’s last three Playoff runs. But, because this may yield more of an apples-to-oranges comparison than we’re hoping for, we also have to consider Mitchell’s role in improving Utah’s offensive efficiency. 

    During the Playoffs, Mitchell doesn’t usually yield a highly-efficient style of offensive play. His rookie campaign, one marveled for its “achievement” of dethroning two All-NBA players in the first round (Paul George and Russell Westbrook), produced a measly 1.01 points per individual possession in the second season. Relative to the league average of 1.09 points per possession in 2018, Mitchell wasn’t truly helping his team succeed in the manner Payton suggested. Per Synergy Sports Technology, Mitchell averaged the sixth-most isolation attempts per-game in the 2018 Playoffs. However, unlike great and high-volume isolationists, Mitchell’s offensive play didn’t net many points. As it turns out, he was actually hurting Utah’s offense more than he was helping it. Mitchell’s isolation attempts yielded a woeful 0.95 points per attempt. If Utah replaced its entire offense with his postseason scoring “heroics,” they would have sported one of the worst Playoff offenses in league history.

    The trend carries over to an even less successful run in 2019 that saw Mitchell produces a putrid 82 points per 100 individual possessions. Namely, if the above scenario were invoked again: if the Jazz allowed Mitchell to captain the entirety of the team’s offensive possessions (keep in mind the offensive rating measurement does not account for any late-game fatigue), they would very likely have the most inefficient offense in league history, when his isolation output made the ugly drop to 0.75 points per possession on only one fewer attempt per-game. The only season that defies this trend was last year’s first-round series versus the Denver Nuggets, in which Mitchell’s scoring numbers finally exploded. He averaged an incredible 37.8 points per 75 possession on a True Shooting percentage nearly 13% greater than league-average. He also averaged 1.11 points per isolation possession, a massive improvement from his previous two postseasons. What spurred this seemingly inexplicable change?

    Variance

    The widespread solution, one likely employed by those similarly-minded to Payton, is that Mitchell had a “scoring epiphany” of sorts that allowed him to “finally figure things out.” To treat Mitchell’s scoring burst in the previous Playoffs as an accurate representation, or even an adequate signal, of his true scoring abilities would be a product of multiple fallacies, all of which are explored in Thinking Basketball. The first relates to the time span in which Mitchell produced these numbers, a mere seven games, against a mediocre defense for that matter (Denver had the #16 ranked defense in 2020). Since the duration of Utah’s run was only seven games, it’s supposed to feel like a sufficient representation of Mitchell’s postseason value, except it isn’t. The second bias present relates to variance. Because Mitchell’s averages were notably good in the series, it’s easy to overlook the negative aspects in that timeframe.

    He had arguably his best game in the series in Game 1, which saw him score a mind-boggling 57 points en route to a 45.1 Game Score, a composite metric that numerically evaluates a player’s performance in a game. Keep in mind, however, that Game 7 of the same series saw Mitchell score a dreadful 4.5 score in the same metric, scoring only 22 points as opposed to an average of 36.3 points-per-game in the series. The lesson to be learned from this case is that a large number of unexpected, unattainable leaps in numbers that will never be reached again by the same player are products of variance. Mitchell, given eighty-two games versus the exact same Denver roster, in the same setting, alongside the same teammates, and maintaining the same level of “true” value, would have seen his points-per-game fall much closer to his regular-season average of 24 points-per-game. 

    Due to the prior information we have on Mitchell, addressing these numbed biases shows that he wasn’t “truly” the league’s best scorer in the postseason. Rather, he was one in a long line of players whose degree of variance in the right timeframe creates the illusion of boundless leaps in talent. Further fallacies with Mitchell’s title as Utah’s best player include the “Lone Star Illusion,” the unsound mitigation of supporting cast efforts to divvy team credit, which I’ll address later on. My goal with this and future posts in the series is to update these communities with their unconscious biases, ones no one is immune to, and hopefully tease out the internal questioning we all need. To everyone reading, and especially Payton (!), I encourage you to add Thinking Basketball to your reading list.


  • My 2021 NBA All-Star Game Ballot (Part 1?)

    My 2021 NBA All-Star Game Ballot (Part 1?)

    (? CBS Sports)

    Mere weeks away from the event, the NBA has launched its annual fan voting process, which will partially determine the players who will represent the best and brightest in basketball. This year’s ballots are in a strained position, as a single month of data and film breakdown will be used to evaluate players for the delayed 2021 season as opposed to a regular four months, which leaves unsustainable hot starts and shaky box scores in higher consideration. With that in mind, I’ll reveal the rosters from either conference I would assemble if they were my choices.

    Criteria

    My selection process is fairly straightforward. I won’t be taking team records into account; this is a list that recognizes players, not units. I also won’t be treating unstable box score stats as if they are accurate representations of how good a player is. Instead, I’ll only penalize players for firing blanks in the first month of the season if it’s a true indicator of some form of decline. The same goes for deceptively uber-efficient scorers. The traditional “box-and-record” (it’s almost poetic this can be abbreviated “B/R”) approach doesn’t have a place in this criteria. I’ll be choosing players based on their on-court impact and ability to put casts of varying quality in position for home-court advantage come Playoff time.

    Rather than simply revealing my ballot, I’ll also group my actual and potential electees into tiers, because there’s obviously wiggle room with every list. This will hopefully clear the air if one of my picks seems disconcerting.

    “Absolutely”

    These are the players I am entirely confident in voting for, ones who would distinctly pass the threshold for “All-Star level” player if the season ended today. I would find it an outright crime if one of them were to miss the count.

    • Giannis Antetokounmpo (East)
    • Bradley Beal (East)
    • Jimmy Butler (East)
    • Kevin Durant (East)
    • Joel Embiid (East)
    • James Harden (East)
    • Kyrie Irving (East)
    • Stephen Curry (West)
    • Anthony Davis (West)
    • Luka Dončić (West)
    • Paul George (West)
    • Rudy Gobert (West)
    • LeBron James (West)
    • Nikola Jokić (West)
    • Kawhi Leonard (West)
    • Damian Lillard (West)

    Most of the names in this tier are fairly self-explanatory, so I’ll refrain from delving too deep as to why I think Kevin Durant or LeBron James should be an All-Star this season. Truth be told, the only player I see garnering even the slightest of controversy here is Jimmy Butler. Yes, his efficacy on the offensive end is lagging far behind most of his cohorts so far, but he’s added some extra spice to his defensive makeup: strong reads, great deflector, and the general playmaking on that end to counterbalance his early-season shooting woes.

    “Probably”

    Although I’m not entirely sold on this next bunch as definitive All-Star level players, I think there’s a small room for doubt that they belong on the ballot.

    • Bam Adebayo (East)
    • Khris Middleton (East)
    • Jayson Tatum (East)
    • Myles Turner (East)
    • Trae Young (East)

    Perhaps it’s a bit early, but I’m buying in on Myles Turner. His offense barely keeps itself afloat at times, so this is a choice clearly based on his being an absolute flyswatter on the defensive end. Past the blocks per game numbers and stunning rim protection, Turner is becoming one of the league’s best defenders very fast. He makes a strong argument as having been the sport’s most underrated player in the past three years.

    “Maybe”

    If I squint hard enough, I can see a reasonable case as a legitimate All-Star for all of these players. However, not all of them will end up on my final ballot because of either a lack of spots or significant reasons for doubt.

    • Jaylen Brown (East)
    • Jrue Holiday (East)
    • Kyle Lowry (East)
    • Domantas Sabonis (East)
    • Pascal Siakam (East)
    • Ben Simmons (East)
    • Devin Booker (West)
    • Chris Paul (West)

    “Not quite there”

    These are players who, if need be, could fill a spot as an injury replacement for the All-Star Game. They’re as the tier name suggests, “not quite there,” but on the verge of entering the conversation.

    • Malcolm Brogdon (East)
    • Gordon Hayward (East)
    • Zach LaVine (East)
    • Marcus Smart (East)
    • Nikola Vučević (East)
    • Kemba Walker (East)
    • Mike Conley (West)
    • DeMar DeRozan (West)
    • Shai Gilgeous-Alexander (West)
    • Brandon Ingram (West)
    • C.J. McCollum (West)
    • Donovan Mitchell (West)

    This last tier was the hardest for me to assemble considering how many guys could rightfully belong in the group. However, I chose to only include players who showed the clear-cut potential to end the season at or near All-Star level. Think of the “not quite there” players as “sub” All-Stars.

    Final Ballot

    The previous groups lay out a wide range of options for players who could be worthy of making the final cut, but positional restrictions and a roster cap mean not every one of them will make an appearance on the following list. Using the tiers as a framework along with the aforementioned positional requirements decreed by the NBA (four guards, six forwards, and two wild cards), here is my selected roster for either conference.

    Eastern Conference

    Starters

    • (G) Kyrie Irving
    • (G) James Harden
    • (F) Kevin Durant
    • (F) Giannis Antetokounmpo
    • (F) Joel Embiid

    Bench

    • (G) Bradley Beal
    • (G) Trae Young
    • (F) Bam Adebayo
    • (F) Jimmy Butler
    • (F) Khris Middleton

    Wild Cards

    • (W) Jayson Tatum
    • (W) Myles Turner

    Western Conference

    Starters

    • (G) Stephen Curry
    • (G) Luka Dončić
    • (F) LeBron James
    • (F) Kawhi Leonard
    • (F) Anthony Davis

    Bench

    • (G) Damian Lillard
    • (G) Chris Paul
    • (F) Paul George
    • (F) Rudy Gobert
    • (F) Nikola Jokić

    Wild Cards

    • (W) Devin Booker
    • (W) C.J. McCollum

    Keep in mind that a lot of the players at the end could be reasonably switched out with similar-impact players in my eyes, but if I had to decide which ones to send to Indianapolis, this is my ballot. I intend on doing a follow-up to this post in the week or so leading up to the actual game if there are any changes, although I don’t expect much of the starting lineup and front-end of the bench to undergo any switches.

    Thanks for reading and have an awesome day!


  • Darius Garland and Collin Sexton: Duds or Studs?

    Darius Garland and Collin Sexton: Duds or Studs?

    I’ve been fairly critical of Cleveland’s young backcourt of Darius Garland and Collin Sexton in the past, citing poor impact metrics that indicate relatively low value to the team. However, there’s room for optimism for the pairing. Sexton was one of basketball’s least effective players as a rookie but made a clear improvement in his sophomore year, upgrading in Basketball Index‘s “LEBRON” metric by +2.6 points. Could his continuous development and Garland’s strong start (+0.145 increment in Win Shares per 48) as a second-year player prove the recently-coined “Sexland” to be the future of Cleveland basketball, or the next in a line of disappointing draftees?

    The validity of last season’s impact metrics for the two as a reference for value to the Cavaliers is in question. Although the jury is still out after six games, it’s reasonable to suggest Garland and Sexton will show distinct improvements from last season in these one-number evaluators. The method here will be to take a deep dive on Garland’s and Sexton’s seasons thus far and how their tendencies and skills translate to impact, and how the career trajectories of similar profiles could indicate future growth.

    All footage in the article is owned by the NBA and its partners. It is intended for Fair Use.

    Film Study

    Garland created an estimate of fewer than five shots for teammates every 100 possessions as a rookie, which makes this opening possession against Indiana on New Year’s Eve notable. The opportunity he creates here is for Dante Exum (#1) who stands at the left corner. As Garland curls around the perimeter up near the right elbow, he’s not in a strong position to make a pass to Exum on the weak side without the latter’s defender (Oladipo) given too little time to rush back. Therefore, that instance isn’t an opportunity created.

    It’s the point at which Garland passes the free-throw line and shows indication of a floater that denotes his opportunity created. He continuously tugs the defense in such a manner that a potential field-goal attempt is created for Exum. The second important detail in the possession is Exum’s defender, Oladipo, being one of the most renowned perimeter defenders in basketball. Perhaps it was merely a product of Garland’s strong start, but managing to pull a defender of Oladipo’s caliber away from his assignment so dramatically is a positive sign of Garland’s offensive influence.

    This possession ties into the one preceding it, which continues the idea of his uncanny creation thus far. Garland runs the ball down the court at a relatively safe pace, without having a strong probability to score within the first several seconds of the shot clock. However, aside from Kevin Huerter attending to Cedi Osman on the right side of the arc, the entire defense abandons their assignments and keeps their eyes on Garland. This left two opportunities for the men on the left side of the perimeter, to one of which Garland makes the pass and is credited with a potential assist and an opportunity created.

    Garland showed a continuous trend in the second quarter against Philadelphia in which he’d start his attacks on the left side. He sizes up Danny Green on the perimeter and makes a consecutive drive near the baseline for a potential field-goal attempt in the paint. Instead, he makes a (lofty) pass to Larry Nance Jr. who makes the extra pass to Andre Drummond. Garland consistently shows signs that creation will play a large role in his future as an offensive player, and his ability to spur offensive action through extra passing opportunities gave similar tendencies to Jrue Holiday with the Pelicans. Garland may never be a dominant on-ball engine, but his steady offensive sparks may mean he could quarterback a respectable offense as he approaches his peak.

    Garland wasn’t the most impressive rookie defender last season, but his effort on that end allows for some promising views. As T.J. McConnell runs the ball down the court, Garland maintains a safe and steady distance while putting some pressure on the leading Pacers. There’s still room for him to grow in this facet, but strong defensive awareness highly translates to adequate levels of team defense, which would be a good threshold for Garland if his offense truly breaks through.

    Garland gives further indication of defensive awareness in Cleveland’s sixth game versus the Atlanta Hawks. When Brandon Goodwin passes the ball to Bruno Fernando at the top of the arc, the former moves down near the right teeth and feigns to free Kevin Huerter and attempt to attempts to unclog an opportunity for himself. This plan fails due to Garland’s solid mixture of tracking the movement of the rock and the location of his assignment. The only thing I can really point to as a negative is his too-large shuffle as Goodwin approaches the basket, which could have potentially permitted a safer pass. Garland’s off-ball defense will need some fine-tuning in the future, but he’s surely on the right path.

    Despite positives as a defender off the ball, there are instances in which he and a teammate will miscommunicate and allow an opportunity to be created for the opposing team. As Garland’s assignment passes the ball to a teammate just outside the left teeth, Garland alleviates pressure on the former and signals to Sexton (it seems) for coverage. Garland was in the wrong here, and Sexton continued to attend to his assignment, which left coverage in the vicinity of the free-throw line largely neglected. There are obviously a few kinks to shake out with Cleveland’s younger backcourt, but it suggests the offensive promise of the duo is greater than that defensively.

    Sexton passed the threshold in several impact metrics as a net-positive player on offense last season. Do those figures hold a lot of weight? As a third-year member of the Cavaliers, Sexton’s offensive activity is looking to make further jumps. Garland makes a standard run with the ball down the court and Sexton moves upward from the left corner. He quickly counters with a strong cut to the basket, moving diagonally to the restricted area. The ease and smoothness with which Sexton makes the drive, which leaves C.J. Wilcox totally stumped, is a strong case of defensive exploitation.

    This possession versus Atlanta is a good representation of Sexton’s offense, which is a mixed bag at the moment. He takes advantage of JaVale McGee’s screen as effectively as any player could and shows a strong bounce as he falls back outside the perimeter. Sexton does a great job of penetrating to just outside the restricted zone and losing De’Andre Hunter, but he shows strong hesitance to take the (more efficient) opportunity, instead launching a pass to Cedi Osman at the right corner. Huerter is given sufficient time to perform adequate coverage and Sexton’s attack fizzles out.

    The ideas present in the previous possessions are furthered in previous games. A lengthy string of drives and passes proved to be an exemplary reflection of Sexton’s capabilities as an offensive engine. His passing is most comparable to a loose cannon: a lot of speed to support its path but lesser technique. The same principle applies to a lot of his offensive court actions, which consist of dynamic movement on and off the ball that could easily strain a defense, but lacking the finishing abilities to close them out.

    Sexton’s defense is universally seen as troubled in the analytics community, with consistently-negative scores in impact metrics. This possession suggests some merit behind the numbers. When the Pacers run the fast break, he lands at the position at which Myles Turner would be only a second later. Rather than providing Drummond with some help, he opts for Aaron Holiday, who casually curls around to the left corner. Sexton is in a clear position to assist Drummond (who allowed 57.9% of opponent field-goal in the paint last season and committed four fouls every 75 possessions) and Turner clearly indicates a field-goal attempt, yet he refrains.

    Sexton’s defense is in question, but the physical tools he shows on offense are transferrable to positive defensive signals. During this possession, he passes through the screen action to meet Cam Reddish at the cusp of the halfcourt logo. Sexton’s maximum pressure is extremely straining for an offense, but at the same time, his physical approach makes it more foul-prone. He shows a tendency to bounce on and off of these matchups, maintaining an average distance that shouldn’t justify too many foul calls. Sexton may be overzealous with his contact at times, but the general scheme of his moving on-ball defense shouldn’t put too large a cap on his future.

    I was continuously impressed by not only Sexton’s off-ball offense but his off-ball defense. Throughout this possession, he gives multiple instances of clear identification and execution of rotations and switches. Although his wild motor gets the best of him near the end of the play, he almost has that “sixth sense” that not many defenders exhibit, which allows him to track both his matchup and the movement of the ball without turning his head too often. Sexton’s on-court defensive coordination and style of attentiveness give me inklings of current Russell Westbrook’s off-ball defense.

    Impact Evaluation

    Garland’s offense showed solid indications of future driving potential. Earlier, I compared his maximized role to Jrue Holiday: one that allows him to author a good-not-great offense. His potential as a passer is still vague; Garland’s Passer Rating as a rookie player would place him on the wrong side of the interquartile range for his position. However, it’s more likely the quality of Garland’s passing peaks after his physical prime, which leaves some room for potential growth. I expect the driving force of his offense to be subtle creation and consistent sparks of ball movement, which could relate to strong-positive offensive impact.

    I don’t ever see Garland becoming a strong positive as a defender, which isn’t only a product of smaller stature. He certainly shows more signals as an on-ball contributor than his counterpart, and (as is with all young players) there remains time for growth, but I haven’t yet seen the above-average influence defensively that’s present in other players with Garland. He’ll likely function most similarly to a point of attack defender. Despite some on-ball positives, a lack of rigorous technique and coordination leads me to believe Garland will never be a “good” defender.

    Sexton is a more interesting case. He’s managed to string together a twenty points per game campaign on respectable efficiency and is on track to replicate those figures, perhaps to an even higher degree. Sexton will likely be a strong scorer as his efficiency (naturally) increases, but a lack of playmaking signs leads me to see him as more of a cog than an engine. His role as a secondary scorer is furthered by his movement off the ball, which impressed me more than I expected, a skill that would function well alongside a more dominant offensive star with stronger playmaking. Resultantly, I’m a fan of his pairing with Garland. If the Cavaliers can draft or acquire a star player to take the reigns, the two could be strong contributors to a potentially-great offense.

    To become even an average defender, Sexton would have to refine his routine. Contact-heavy on-ball defense with eager tendencies wouldn’t fare well if he becomes the primary point of attack for the opposition, and especially not in the Playoffs. I’d expect he’s maximized as a defender on the wings, tracking movement of perimeter players and limiting the opportunities for foul risk. I hesitate to immediately eliminate the possibility of Sexton making a large jump as a defender, as I think it’s more possible than the average player in his position, but I wouldn’t bet on it either. My prediction for Sexton is to remain a negative-impact defensive player.

    As mentioned earlier, I’ve never been a strong supporter of the two in the past, so I went into this evaluation with an open mind to see if there were any strong signals to overturn my previous thoughts. My concluding expectations for the two are (maybe) on the pessimistic side, but I don’t see too much room for All-NBA level on-court impact. Garland is more likely to become a true driver on offense to me, although that role wouldn’t extend to great team offenses. Sexton would likely be the strong scoring option alongside that drive; and I could see the combined power of the two, assuming fairly average teammates, reaching good-not-great offensive heights. Garland’s most comparable role is, as stated earlier, Holiday-esque: the go-to on a solid offensive team, while his cohort is more of a “placeholder star” as the number-one man, similar to Harrison Barnes’s significance to Dallas’s rebuild during the late 2010s. (This isn’t to compare playstyles, just roles).

    So, with an evaluation completed, is “Sexland” the future of Cleveland? Yes… and no. I don’t expect the two of them on their own to carry an unsupported roster to strong Playoff heights. I think their roles in the team’s succeeding seasons are as secondary and tertiary stars to a more effective offensive driver, although Garland’s skillset may put a cap on how those two (he and the new star) could function together. If I had to predict now, I’d say Garland (maybe) makes an All-Star team or two, potentially not in the most deserving manner. I see Sexton as a more probable electee in the next two or three years, mostly because his scoring averages would woo the voters. Until further notice, all we can do is sit back and watch the future of Cleveland’s young, refreshing, and dynamic backcourt!


  • Eye Test vs. Analytics

    Eye Test vs. Analytics

    It’s the conversation that has captured the hearts and minds of basketball fans across the globe, one that becomes increasingly prevalent as advancements in the sport are made, and one that doesn’t look to going away in the near future; yet, it is the most pointless debate in the history of the sport.

    Ever since Dean Oliver spurred the analytics revolution with his 2004 novel, Basketball on Paper: Rules and Tools for Performance Analysis, the NBA has seen a constant growth in the number of advanced statistics and one-number metrics. Since then, a (false) belief has evolved: when it comes to evaluating basketball players, someone is either an “eye-test guy” or an “analytics guy.” The evaluator either watches a five-minute highlight reel and lets his or her biases take over or skims a stat sheet without having considered any context.

    There are extremists in the sport, with the two previous examples defining small subsets of the basketball population; however, these cases of dogmatism are far less common than expected. Very rarely will we come across someone who adheres to only one, and not just because even the “eye-test guys” will cite points per game at times. The difficulty of self-evaluation is corroborated in basketball with how people assume methodological principles.

    I’ve held hundreds of conversations across various platforms over the years, especially ones that compare players. When I reference a one-number metric to open a debate, I’m usually told some variation of “watch the game.” When I begin with an on-court observation (for example, Hassan Whiteside’s more error-prone defense), I’m told to look at how good his impact metrics are. More often than not, these responses come from people who use a mixture of both the eye test and stats. So what’s the deal here?

    The “Eye-Test Guys”

    For the purpose of this exercise, an “eye-test guy” is someone who solely relies on his or her thoughts from watching basketball. This does extend to the box score, which virtually all basketball fans cite, but this example holds a strong emphasis on intuition and personal value systems.

    Similar to analytics, there’s a “smart” way to eye-test games and there’s a… “risky” way to eye-test games. The more comprehensive approach places an emphasis on the aspects of the game that aren’t or can’t be tracked. It would clearly be unwise to sit through thirty-six minutes of eighty-two games to track a star player’s point per game when it could be found on Basketball-Reference with the click of a button (unless you’re a scorekeeper, of course). The second hindrance, one that’s a natural tendency of eye-testing, is to “ball-watch.” This means the viewer only watches the path of the basketball. This isn’t necessarily a “bad” thing to do, but it limits the observations the viewer can make given that so many court actions occur off the ball. Ball-watching is a large reason behind the heavy emphasis on offense in a typical evaluation.

    What makes someone an “eye-test guy”? Namely, why would someone push back against the so-called advancements in basketball? A large factor is the time at which the person entered the world of basketball evaluation. If they grew up in the 1970s with points per game and field-goal percentage as the game’s leading measurements, then the concepts of Plus/Minus and RAPM will likely seem like remote hokum. Conversely, if someone enters the field in the late 2010s, which hosted the boom of impact metrics, then they are more likely to accept these figures as important and necessary measurements.

    This concept of “analytical acceptance” is the driver behind “eye test versus analytics” conversations. It also explains why the analytics-oriented crowd (apart from the extremists) is usually easier to converse with and more open-minded than the traditional crowd. I’ll be fairly critical of both sides in these paragraphs, but the receptiveness to new ideas and a smaller risk of belief persistence among the analytics community does give it an edge over the traditional community in the modern era. (Although, this is really just one person’s opinion). This by no means is to say analytics are more important than the eye-test, rather those who support the former are a better fit for the contemporary state of basketball evaluation.

    The “Analytics Guys”

    Due to the short-lived dominance of analytics in the public eye, the proportion of “analytics guys” is far smaller than that of “eye-test guys.” Conversely to the latter, “analytics guys” don’t feel the need to directly observe the court actions of basketball games to make an informed opinion, instead opting for stats and metrics that estimate a player’s value to his team. This style is a “low-risk, low-reward” of sorts. Impact metrics do reflect a player’s value to his team more than most realize, but the largely overlooked detail is that these measurements represent some players very well and other players more poorly.

    “Analytics guys” are rare, not only due to the more recent interest in advanced statistics, but because it takes a very specified introduction to evaluation of the sport. To build a relentless dependence on advanced statistics, someone must have first been acquainted with these measurements before game-watching techniques. If analytics are presented as the unbiased, holy-grail statistics made to surpass all human errors, the right mindset can develop a strong attachment. As mentioned earlier, impact metrics have varying levels of correctness, with some measures that are very good and some that embellish the confounding variables that dilute them.

    It’s more difficult to make as many judgments on the “analytics guys” than the “eye-test guys” due to their rarity and short-lived reign. The largest positive of the mindset is the fairly accurate picture of value they will reference, with the largest negative being a total lack of context behind the numbers. It would be impossible to distinguish the good from the poor scores with numbers alone.

    The Answer?

    Analytics and the eye-test are “one and the same.” They’re both observations of what happens on the basketball court. Very little separates the two, with the main difference being how the information is displayed. Eye-testing findings will likely be in the form of detailed notes while analytics findings are broken down into one or two numbers. The “eye-test versus analytics” debate doesn’t compare apples to oranges as previous thought; it’s almost like comparing red apples to green apples.

    Although a lot of people struggle to see a middle ground between the eye-test and analytics, there’s a very distinct option on this front. The eye-test is best for observing certain actions while analytics are better for others. If the goal is to judge off-ball movement, there aren’t any figures that will effectively capture it, which makes the eye-test the more appropriate route. If the goal is to judge a player’s “most-likely” influence on the game score, analytics is the superior option. I’ve had several eye-test enthusiasts claim an acquired ability to determine impact with visual methods alone, which simply isn’t true. Human minds aren’t capable of absorbing and interpreting tens of thousands of events, and doing so would be an overestimation of cognitive processing. That’s why analytics were created: to ease some of the burdens on our brains.

    The bottom line is that the eye-test and analytics are each integral parts of basketball evaluation. Adhering to one method or the other will prove a recipe for disaster. They each provide important pieces toward making an informed opinion, with one being more suited for some aspects while its counterpart is better for others. Furthermore, in essence, they’re different interpretations of the same information, which makes the “eye-test versus analytics” debate the most fruitless conversation in basketball.