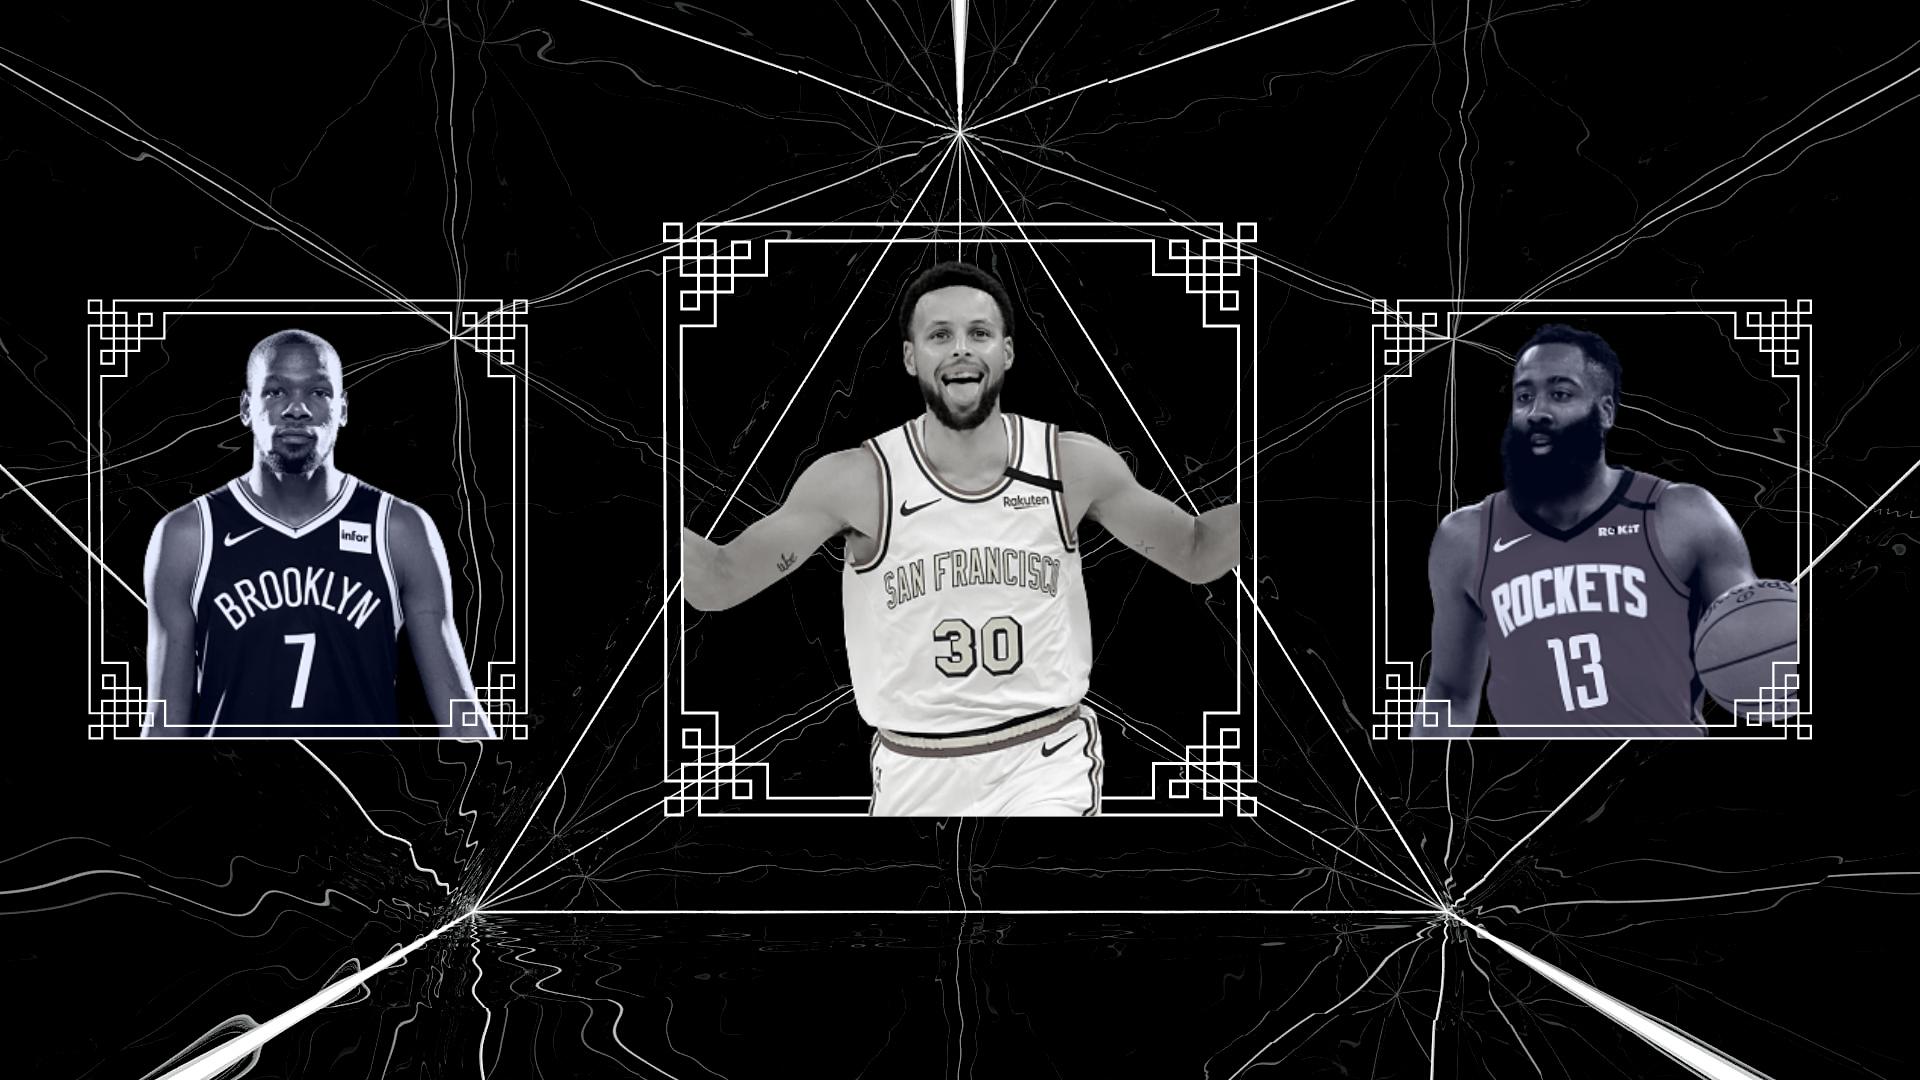
(Picture courtesy of The Ringer)
Despite sporting one of the greatest offensive forces in league history, the Houston Rockets have repeatedly failed to win a title. It drew claims that James Harden’s style of play, an emphasis on ball-pounding and isolation scoring, couldn’t win a team a title and that Daryl Morey’s analytical approaches were futile. Let’s take a look at each of the past six iterations of the Rockets to map a general arc of the team’s performances in Harden’s superstar reign.
- 2015: +3.8 SRS (#7) | WCF loss
- 2016: +0.3 SRS (#15) | First round loss
- 2017: +5.8 SRS (#3) | Semifinal loss
- 2018: +8.2 SRS (#1) | WCF loss
- 2019: +5.0 SRS (#5) | Semifinal loss
- 2020: +3.1 SRS (#7) | Semifinal loss
In the last six years, the Rockets have rarely underperformed in the Playoffs considering their regular-season proficiency. As the #7 team in the NBA in 2015, they managed to make the Conference Finals, a berth (in theory) saved for top-four teams. Houston’s sudden drop in 2016 and a first-round exit line up perfectly. 2017 and 2018 were the two seasons in which the Rockets’ face value didn’t live up to par in the second season. In factoring the landscape of the Western Conference that year, there were two teams better than Houston – Golden State and San Antonio – the eventual Conference Finals matchup. 2018 was anomalous; the Rockets were the best regular-season team in the West by a large margin, yet lost in the Conference Finals. Why?
The series went to seven games, a back-and-forth battle in which neither team gained solid ground until the very end. Employing a certain rationale, the “luck factors,” the Rockets “should have” won the series. Houston rostered a top-ten level Chris Paul (+5.0 RAPM, #3 in the league) whose absence in Game 7 wavered the playing field, although it might not have been enough to overcome the nine-point deficit. Introduce the “27 consecutive missed three-point attempts.” Golden State was a good defensive team that season (#11 in DRtg), but not good enough to not chalk Houston’s shooting woes to detrimental luck. As a team, the Rockets posted an abysmal 43.9 eFG% in Game 7, a 5.7% decrease relative to their series average. As we examined in my Bucks/Raptors study last month, teams that experience massive drops in efficiency underperform in the Playoffs; and among Dean Oliver’s offensive four factors, efficiency is by-far-and-beyond the most important and indicative.
However, if we examine the aggregate of the series, Golden State outscored Houston by 9.6 points every 100 possessions, a retrospective expectation of 77% odds to win the series. In theory, the Warriors “should have” won the series in a mere five games. Therefore, we can identify good and poor luck on Houston’s behalf and conclude they deservedly lost the series. Considering the closeness of the series in series length and Houston’s poor luck, it’s also reasonable to suggest Morey constructed a true championship team. It’s the difference between absolute and situational luck; the Rockets had poor luck in the latter bisection. If they’d gotten the upper hand in injury and/or only 9% of their shooting luck, Houston would’ve advanced to the Finals; and considering the extremely weak Cleveland Cavaliers in the 2018 Finals, the Rockets would’ve been the clear favorites, and therefore “could have” won a title.
It’s important to examine Houston’s past, factoring in context to consider absolute and situational lucks, to understand the team’s successes or failures attributed to Morey. Due to the information we drew in the overview of the 2018 Western Conference Finals, Morey does deserve compensation for assembling a championship team. As a general manager, he’d essentially constructed a title team; the poor luck he couldn’t prohibit diminished the actual outcome. Therefore, the “knocks” against an analytically-driven perspective were mostly unfounded, although Morey’s tenure as a GM has also had an inverse of large question marks, which precedes the question: So why do the Rockets continue to fail? Morey’s decisions in the office have shown to be great as well as… not so great. I’ll take two of Houston’s trades in the last three years to examine this dichotomy and how they eventually dictated the team’s track record in the Playoffs.
Chris Paul to the Houston Rockets
- Houston receives: Chris Paul
- LA receives: Patrick Beverley, Sam Dekker, Montrezl Harrell, Lou Williams, and 2018 FRP
The acquisition of Chris Paul was an ingenious transaction on Morey’s behalf. It was the nail in the coffin for his construction of a championship team. However, the trade received retrospective criticisms due to the rise of Beverley, Harrell, and Williams with the Clippers, but I’d argue both teams “won” the deal. Morey chose to pair Paul with Harden, and here I’ll introduce a key principle of today’s introspection: portability. Portability explains how different players’ situational value, or the contributions a player makes in certain situations, scales alongside great teammates. Philosophically, it makes sense a +5 player doesn’t automatically transform a +8 team to a +13 team. Firstly, there’s never been a +13 team in league history, and we’ve seen an even-more profound scenario unfold to support portability. In 2016, Kevin Durant ( > +5 player) joined the Warriors (+10 team) and – ignoring the lineup continuity of that team – improved them to a +11 squad. This isn’t to say Durant was a +1 player, rather his – and all great players’ – impacts diminish alongside better teammates.
Applying this principle to Harden, we can deduce he was (and still is) not a high-portability player. His shooting and passing, the two most “scalable” offensive skills, are adequate from the skill-only perspective; however, upon deeper examination, Harden’s originally positive portability in 2014 has decreased. He’s historically in the 99th percentile in seconds per touch, a measurement of how long the ball remains in a player’s hands every time he receives it. Harden’s ball-dominance and isolation-heavy scoring, aside from acting as a Harden cliché, is one of the less portable skillsets in the NBA. We saw this during Paul’s first season in which his contributions took a significant dip. (For context, Paul is a neutral-portability player.) He was equally involved in the offense as he was in his previous season with the Clippers (|0.1| difference in USG% / |3.9| difference in offensive load) but experienced reductions in efficiency (-2 TS+), free-throw rate (-5.4 FTr), creation (-2 opportunities created), passing quality (-1.2 Passer Rating), and playmaking value (-0.8 PlayVal). Players of Harden’s likeness are bonafide megastars… who come with a price: radically diminishing the efforts of teammates.
Russell Westbrook to the Houston Rockets
- Houston receives: Russell Westbrook
- Oklahoma City receives: Chris Paul, FRPs in 2024 and 2026, FRP swaps in 2021 and 2025
With the information we have now, Oklahoma City “fleeced” Houston in this trade. Houston left go of two first-round draft picks (1-4 protected) and acquired a point guard of equal or greater equity to Westbrook. More importantly, Houston’s fatal flaw was an inability to recognize portability. Before the trade went through, Westbrook clocked in as the least-portable player among measured players in the 2019 season. The increased struggles to mesh Westbrook with other star players had already been apparent (his historic MVP season fell to borderline All-NBA considerations a season later), yet Houston chose to pair him with Harden. Critics who pointed out the pairing of two of basketball’s ball-dominant stars as a poor decision were correct, as of now. Houston had a -1.9 drop in SRS with an average roster continuity (65%). More surprisingly, though, is how Westbrook’s situational value massively decline with the Rockets. His game-scaled APM value hovered around +3 in 2019; however, in 2020, that number (per Ryan Davis’s RAPM) has dropped below +0.7. Houston’s micro-ball lineup is tailored to support players with competent distance scoring, a skill at which Westbrook is arguably the worst among active players.
Near the end of the Rockets’ season this year, Westbrook provided nearly no situational value in Houston. If he were on an average – or even a random team – Westbrook’s situational value would skyrocket; his fit with the Rockets is simply detrimental to his role on that team. For example, a season after posting a Passer Rating ~ 8.0, that value dropped to a tick over 5.5. None is this is to say Westbrook was worth nothing to the Rockets; Backpicks estimates Houston improved by ~1.5 points per 100 with Westbrook on the floor. It’s also worth noting that the Rockets are by no means a bad team. They were still the #4 team in the West with both a good offense and a good defense. However, Westbrook’s low-portability and inconsistencies with the micro-ball scheme may hold the team back. To understand the other half of this phenomenon, we have to observe Chris Paul in his new environment as well. His successes or failures in Oklahoma City dictate a broader perspective to Harden’s portability and his tendency to diminish teammates.
To understand Paul’s performance with the Thunder, a key principle of portability needs a refresher. Low-portability players don’t necessarily diminish the efforts of their teammates nor lower their situational value alongside better teammates; it’s one or the other. Take Harden: his play has remained stagnant (or even improved) in each of the past six-or-so seasons. He’s an example of a player whose efforts remain similar while diminishing the efforts of his teammates, i.e. Russell Westbrook. Westbrook has played alongside historic iterations of Kevin Durant and even 2019 Paul George. However, during those seasons, Westbrook’s own contributions decreased. He’s the example of a player whose efforts tend to diminish while his greater teammates keep their value. With that in mind, let’s take a look at Paul. Paul drastically improved in OKC after an injury-riddled 2019, cracking the #8 spot on my “Top 10 Players of the 2020 Season” list. He experienced leaps in scoring volume, efficiency, scoring and playmaking value, creation, passing, turnover rate; take your pick of skills. Paul converted on more than 50% from mid-range and over 75% at the rim en route to a reviving 2020 campaign. Between Paul and Westbrook, the latter having been significantly valued over the former in their swapping, Paul is – as stated earlier – perhaps equal to or greater than Westbrook in terms of isolated value.
So why do the Rockets continue to fail? Morey has a history of pairing low-portability stars, the product of which results in lesser forms of either star (take Harden and Westbrook, for example). In contrast, the Golden State Warriors of the late 2010s assembled the high-portability stars of the NBA. Last season, the only three players to register an offensive portability score greater than one were Stephen Curry, Draymond Green, and Klay Thompson. Teammate Kevin Durant tied as the league’s fourth-most portable player. Rostering four of the most scalable players in the league created one of the greatest dynasties in league history, the opposite of which Houston has managed. For the Houston Rockets – for “Moreyball” – to truly explode onto the scene, the front office is safer to incorporate players whose skills scale up alongside great teammates, rather than the opposite. The implementation of smarter, more grounded analytical principles could be the key to a championship in Houston.