Author: chromeder


  • How the 1960s Reveal the Red Herrings of Today

    How the 1960s Reveal the Red Herrings of Today

    Last week, I posted a discussion in which I stated Bill Russell was a greater “statistical” player compared to Wilt Chamberlain. Expectantly, most replies were in disagreement. The general framework of my opposition would go as follows:

    Chamberlain averaged more points, rebounds, and assists per game than Russell on a higher true shooting percentage. Is that not enough? Chamberlain accrued 247.3 Win Shares in his career while Russell managed 163.5. But Russell played fewer seasons, so this may not be a fair comparison. Chamberlain contributed .248 Win Shares every 48 minutes while Russell was worth .193 in the same period. “The Record Book” not only had the advantage in the box score but in advanced statistics; therefore he’s the superior “statistical” player, right?

    Ballislife

    More often than not, stats are viewed in their rawest forms. This means points per game are frequently used for cross-era comparison despite the fluctuating rates (difficulties) at which different court actions occur and the number of chances a player has to accumulate those actions (pace). When presented with the opportunity to convert per-game stats to modern values, the majority of responses are more dismissive, stating true statistical comparisons across eras are simply unfeasible. For a long time, this was thought to be true. It wasn’t until the work of analytical pioneers that we were given a good idea as to what an “n” points-per-game scorer in 1970 would average fifty years later.

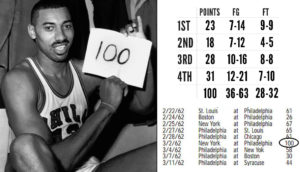
    “Inflation-adjusted” statistics emerged to widespread attention just last year, and the results have been extremely promising… and unemployed. The classic example of converting historical values to modern values is Chamberlain’s 50 points-per-game season. It’s mostly recognized that “The Dipper’s” scoring production wouldn’t equate to the same degree in later times, but exactly how much would his 50.4 points per game change? To start, we’d convert points per game to points per-100 (possessions) using Chamberlain’s raw points per game and his team’s number of possessions per game. (Minutes for teams weren’t calculated until the mid-60s, so we’re praying teams didn’t pass too far over the 48 minutes per game threshold). Chamberlain averaged 38.0 points per 100 possessions, which would rank eighth in the league today. He’s often criticized for such, but here we’ll incorporate a key element of adjusting for inflation: it was harder to score a point back then than it is now.

    NBA.com

    During the 1962 season, offenses scored 93.6 points every 100 possessions, a clear downgrade from 2020’s average offensive rating of 110.6 points. Based on these rates, we can incorporate a factor to weigh ’62 scoring to ’20 scoring. Chamberlain scored 45.4 “inflation-adjusted” points every 100 possessions. If he played in today’s game, “Wilt the Stilt” would average roughly 34.1 points per 75 possessions. Despite his raw scoring rate, Chamberlain’s season was still historical, and he’d likely remain the league’s top volume scorer in any given season using these conversions. The last step is to determine how often he’d be on the court; no star would match Chamberlain’s 48.5 minutes per contest nowadays. The standard protocol in this situation is to compare the average of the top-16 minutes per game in 1962 (40.2) to that of 2020 (35.6). Chamberlain would play approximately 43 minutes per game, from which we can estimate he’d score 40.6 points per game in 2020.

    These adjustments, although entirely valid, are met with knee-jerk reactions. People tend to work against these measurements to, instead, remain with a more traditional criterion. It’s likely due to the figures from which people are informed; basketball knowledge is generally passed down from generation to generation, so one’s aggregate views won’t likely stray too far away from its predecessor. A portion of a generation’s population is the one to make the advancements we’re familiar with today: metrics like Win Shares and play-by-play data. Today, our best achievement is Regularized Adjusted Plus/Minus (RAPM), and more specifically, Jeremias Engelmann’s PI RAPM. Resultantly, plus/minus data receive a lot of pushback compared to, say, Win Shares: a metric that’s more easily interpretable (e.g. “Player A” has 7 Win Shares, he contributed 7 wins). But a more foreign concept like Plus/Minus is then met with a higher degree of conflict.

    Tableau Public

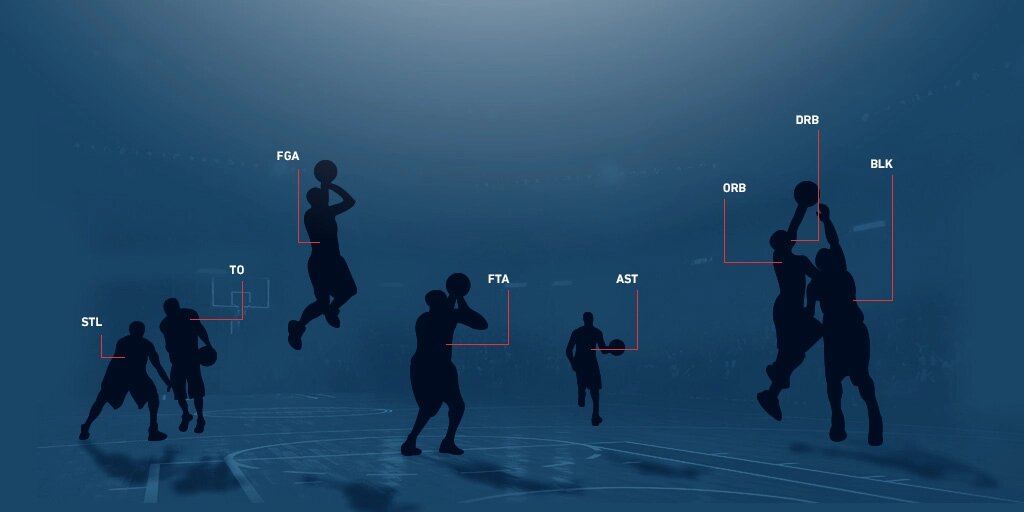
    It’s due to the aforementioned reasons that Wilt Chamberlain is ubiquitously recognized as a superior statistical player to Bill Russell. He checks the boxes of greater raw box scores and a greater score in the most popular and explicit advanced statistic. There are multiple drawbacks to this approach. Earlier, we discussed how statistics are often viewed in their rawest forms, and that still holds true; a very small portion of basketball critics are familiar with statistical adjustments to compare box scores across several decades. But the even larger misconception is the value of the box score. Recently, I plotted the correlation between six samples of three-year luck-adjusted RAPM (from Ryan Davis) and three-year box scores. The offensive component held a moderately-strong r-value; but, expectantly, defense isn’t effectively explained by the box score, making the total box score less indicative of a player’s value than the offensive half alone. Namely, the box score isn’t a strong gauge of a player’s overall value. 

    This phenomenon explains why a player like Bill Russell, a defensive superstar with minimal offensive impact, is seen as statistically inferior to a player like Wilt Chamberlain, whose offensive value dominates the box score. Statistics like points, assists, turnovers, and field goals are a few of many that measure a player’s offensive court actions. The intuitive and statistical explanatory power of the offensive box score is greater than that of the defensive box score, and most are aware; even those who use the box score as a primary reference of value know steals, blocks, and defensive rebounds are often poor indicators of defensive impact. However, this means offense receives far more consideration than defense in cases like award recognition and player-ranking lists. Offense is easier to quantify, easier to understand, and it often leaves defense in the dust. The lack of evaluator metrics in the 1960s, let alone the lesser number of counting stats, often means older players are primarily recognized for their offense to a higher degree than current players are. 

    NBA.com

    Players like Bill Russell are in more strenuous situations in accounting for the methods with which people interpret statistics. It’s less a cause of how point values are designated; say, whether a point scored is truly worth a point to the team. Rather, it’s where the limitations of statistics are drawn. Traditionally, it stops once you start seeing player salaries on their Basketball-Reference page. This means statistical inferencing generally adheres to two categories: simple counting stats and impact metrics. After that, the rest is attributed to the eye test and logical reasoning. This approach severely diminishes the expansive methods of statistical inferencing, an example of which perfectly relates to the ’60s era of basketball: Wilt Chamberlain. He’s widely recognized as one of the greatest scorers of all-time, which he is; but the conclusions drawn from that statement vary. The box-centric approach of statistical interpretation states Chamberlain’s historic scoring makes him one of the most dominant offensive players in league history. However, there’s reason to believe these conclusions may be drawn too fast.

    James Harden started to explored trade destinations in the earlier stages of the offseason. His three most-desired suitors were the Philadelphia 76ers, Miami Heat, and Brooklyn Nets, the middle of which drew a trivial amount of noise, but it was an endorsed deal regardless. The prospect of placing the league’s best volume scorer on the most efficient postseason offense may make some sense initially. But consider the qualities that made Miami’s offense great: movement, balanced attacks, and teammate synergies. If Harden were in that lineup, he’d disrupt all of them. He’s the purest “black hole” on offense, in the 99th percentile of average seconds per touch. If any player in the league eats into teammates’ possessions more than the rest, it’s Harden. His high-usage style would take away from the variety of contributors the Heat would employ in the Playoff’s later rounds. With the decreasing frequency of possessions among teammates, the chemistry of those synergies would also decline. The acquisition of Harden would have put a cap on the Heat’s offensive ceiling, yet they were a team in no need of more scoring.

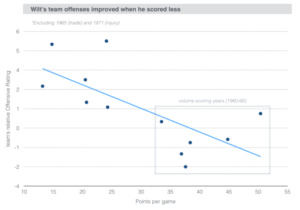
    The impact of volume scoring is overstated by the box score, and the great Wilt Chamberlain is no exception. Ben Taylor’s exploratory analysis of Big Musty’s career gave a piece of evidence that was a nail in the coffin for me to make a verdict on the Harden paradigm: there was an extremely-negative correlation between Chamberlain’s shot frequency and his team’s offensive performance. During his thirty-five-to-fifty points-per-game seasons, Chamberlain’s team offenses were often average, wavering above and below that mark at times for only a few points. When he was traded to Philadelphia and his true shooting attempts rapidly declined, their offense took off. There’s no denying the odds of some overstatements due to the unstable roster continuity of Chamberlain’s teams throughout his career, but the general trends hold: high-volume scoring is more of a floor-raising technique than a skill that will truly lift an offense to historical greatness. These concepts are a large part of what makes statistical inferencing so valuable, and the face-value examinations of the box score work against them.

    Backpicks

    If we apply the same criteria to Russell, determining how certain playstyles relate to team success, we see the opposite: his defensive dominance unlocked historical team defenses. (Due credit to @pdx on Discuss TheGame, who was the one to introduce me to this Russell career trend.) The season before Russ entered the league, the Celtics had the worst-performing defense in basketball. Throw Russell into that lineup, and Boston suddenly becomes the best team defense in a year. The Celtics were an elite defense for every season of Russ’s career, not once allowing opponents to score at a rate more than four points less than league-average; but when he left, their relative defense was raised nearly seven points. Tendencies like these are far greater gauges of a player’s value than a brief overview of the box score because, after all, players only exist to improve team success. They prove a player like Chamberlain may perform well on a team deprived of scoring and in need of posting merely a good team offense, but a player like Russell possesses skills that take a team to dynastical levels. 

    How do the 1960s, specifically, prove how we incorrectly interpret statistics? More rigorous statistical methodologies can prove the superior value of a defensive anchor like Bill Russell over a scoring machine like the Big Dipper during an era that was dominated by scoring and without records of defensive counting statistics during good chunks of either players’ career. Despite the lack of full box scores and impact metrics of today, there are still strong measures to gauge the effects of a player’s skills on his team. All it takes is a little more digging.


  • Examining Potential Trade Suitors for Russell Westbrook

    Examining Potential Trade Suitors for Russell Westbrook

    Recent news marked back-to-back offseasons in which Russell Westbrook has requested a trade from his team. The results that followed last year’s trade, which sent him to the Houston Rockets, has brought Westbrook’s trade value to its lowest point in years. His new team finished the regular season with a +3.1 SRS, a significant decrease from its +5.0 mark the season before. The big takeaway from Westbrook’s tie in Houston was that he’s one of the least “scalable” players in the league. Perhaps this was overstated due to playing alongside James Harden, another ball-dominant offensive superstar, who was in the 99th percentile in average seconds per touch according to Second Spectrum. But a theme remained clear: it’s becoming much harder for Westbrook to impact better and better teams while his conflicting playstyle is intact. Evidently, the likely trade suitors for him are poorer teams. Names include the Knicks (-6.7 SRS), Pistons (-4.4 SRS), Hornets (-7 SRS), and Magic (-0.9 SRS). Would a trade to any of these teams make sense?

    Most likely, yes. Westbrook is still a very good player, but as mentioned earlier, his playstyle could possibly be a hindrance to a great team trying to win a title. So it makes a lot of sense to send Westbrook to a mediocre or a poor team. Not only would Westbrook get to operate under more ideal circumstances, but a team would get a highly-effective offensive player to improve its performance. Houston was an extreme case of his low portability; the squad’s offense was nearly 3.5 points per 100 more-efficient with Westbrook off the floor. But on a team like Charlotte or Detroit, away from an environment that could create such a change, he could look something like his former self. He likely wouldn’t contend for another MVP Award, but Westbrook could help a mediocre team into Playoff contention. That leaves us with the question of the day: which teams make the most sense for Westbrook, and how exactly would he impact those teams?

    New York Knicks

    Westbrook’s name had been associated with the Knicks even before his trade request, and given the abysmal state of the team’s offense, the acquisition of Westbrook could help lift New York to near-adequacy on that end. However, the team has a fairly large problem: floor inefficiency. My study on the Eastern Conference Finals last season suggested effective field-goal percentage was the most indicative of team performance among Dean Oliver’s four factors, and the Knicks certainly corroborated it.

    PBPStats

    Even without percentages, it was clear the Knicks had a lot of cold spots on the floor. A part of it was likely their shot locations. New York hasn’t yet evolved grown into the modern archetype of a three-point barrage, let alone even an average frequency. The team was very close to the lowest three-point shot frequency in the league last season, trailing the Spurs and Pacers by a mere 0.01 points. This is likely due to the Knicks’ stagnant growth in the spacing category. My spacing metric argues New York’s offense was more clogged in 2020 than it was eleven seasons ago, an obvious sign of limited offensive growth. This would likely worsen the impact Westbrook could make in the Knicks’ offense. The team had the fourth-highest shot frequency from within three feet of the basket, and Westbrook led the league in drives per game last season. With the paint already clogged, it would be harder for Westbrook’s scoring to be effective: as evident from his scoring rate in Houston, which improved by 5.4 points per 100 on the most spaced-out team in the league.

    It could be argued that a more clogged offense would promote shot selections elsewhere, but Westbrook isn’t very effective anywhere else. Relative to league average, within three feet of the basket is his most efficient range, and even then he’s below the norm. This is an especially negative sign considering he had the most efficient season from the floor in his career last year. So he fits the theme of inefficient scoring in New York, and that’s mostly a bad thing. The Knicks had a 50.1 eFG% last season, and Westbrook’s 49.3% wouldn’t exactly raise that figure without help from teammates. But another shooting range to consider is the perimeter. Could Westbrook boost the team’s distance shooting en route to a more efficient offense? Likely not. His frequency from deep was lower than it has been in nine years, posting a 3PAr+ of 43. Paired with weak efficiency (72 3P+), Westbrook’s shooting would not push the boundaries of the Knicks’ offense any further than its current state.

    However, there is a strong chance Westbrook could make a positive impact through his passing. If we ballpark his value as a passer, we can come up with an idea as to how he’d raise the ceiling of the Knicks’ offense. By taking the number of points created by Westbrook’s assists and considering the frequency at which he passed the ball, we can estimate he created 0.43 points per pass. But that doesn’t account for the shooting strengths of his teammates. Excluding Westbrook, the Rockets had a 54.8 eFG% last season, which was significantly higher than the league-average of 52.9%. Therefore, prorated to an average team, Westbrook would create around 0.416 points per pass. This is notably higher than the Knicks’ passing production, which clocked in at roughly 0.189 points per pass, one of the worst marks in the league. As the primary faciliatory, Westbrook would provide the most valuable with his passing and playmaking, both of which were understated alongside James Harden last season.

    If Westbrook were traded to the Knicks, there’s a mildly clear preliminary picture as to how he’d impact the team. He doesn’t help them on a lot of fronts including efficiency from the field and shot selection. Westbrook’s scoring would likely suffer due to a more clogged paint, but playing alongside the most ball-dominant scorer of the decade may have understated his scoring rate last season. Therefore, it’s not unreasonable to say Westbrook’s floor efficiency would decline while his scoring rate would remain stagnant. He doesn’t push the boundaries of distance scoring, and he would only mildly increase points through free-throw efficiency (76.3% last season versus the Knicks’ 69.4% as a team). But Westbrook’s passing would be a wild card. He could either push the limits and lift the Knick’s offensive rating to, say, 109 if the league-average hovers around 111, but that number could be as low as 107.5 if increasing age and emphasized weaknesses play larger roles. I’d estimate Westbrook would raise the Knicks’ offense to a middle-ground number, roughly 108 rounded to the nearest whole. The relative offense would range from around -2.5 to -3.5 points depending on the development of Westbrook’s new teammates.

    Detroit Pistons

    The Pistons are in a similar boat as the Knicks: a poor team without a clear anchor. But the good is news is that Detroit is notably better than the Knicks. The Pistons’ offense was -1.6 points worse than average compared to the Knick’s -4.1 relative offense. They’re still a net-negative team (-4.5 SRS), but Westbrook is given much more to work with. He just may be the last push the Pistons need to set forth a solid offense next season.

    PBPStats

    Detroit boasts more selective shot locations than those of the Knicks, with an apparent decrease in mid-range shots and higher frequencies in the two most efficient ranges: the paint and the perimeter. The Pistons were smack in the middle of three-point frequency last season, 15th among teams, at 38.1 three-point attempts per 100 field-goal attempts. Furthermore, the paint is far less clogged in Detroit than it is in New York, the former squad taking 3.1% fewer of their shots from within three feet of the hoop. My aforementioned spacing metric corroborates this. Detroit wasn’t necessarily a team with exceptional spacing, ranking 22nd among teams, but it’s a more desirable situation than the Knicks considering the information we’ve gone over. The positioning of Westbrook’s teammates would likely give him more room to do damage on usage possessions as well as target teammates more effectively than if he were operating in the Knicks’ offense.

    While Detroit seems to be a great place for Westbrook to revitalize his role as “the man” on a solid offense, can we confidently say he’d push the boundaries of that offense? The Pistons were dead-average in terms of floor efficiency, posting a 52.9 eFG% last season; Westbrook’s poor floor efficiency wouldn’t exactly improve that figure if he were on the team. They were one of the worst teams at limiting turnovers; Westbrook fell outside the interquartile range in adjusted turnover percentage, which couples a player’s turnover rate with how often he’s involved in the offense to level the playing field for high-usage creators. Conversely, there are two factors for which he could provide a subtle boost. Detroit was above league-average in free-throw rate, but given the average floor efficiency of the team, it’s clear last year’s offense had some form of untapped potential. Westbrook accounts for three free-throw attempts every ten field-goal attempts, a rate that was actually understated last season in Houston due to his teammates’ spacing (which equals more defenders on the perimeter and fewer in the paint, a mixture that took away Westbrook’s odds of getting the opposition into foul trouble).

    The last time Westbrook was “the man” on a team, he was accounting for four free-throw attempts per ten field-goal attempts, and given Detroit’s lack of excess spacing, Westbrook’s foul-drawing skills would be maximized as a Piston. There’s also his status as an offensive rebounder. Westbrook remains one of the elite rebounding guards in the league, grabbing 5.1% of available offensive boards last season. Detroit had a +0.1 relative offensive rebounding percentage last season, but a decent chunk of that success was due to 48 games of Andre Drummond, the elite rebounder who grabbed 15.3% of available offensive rebounds as a member of the Pistons last year. Given the state of Detroit’s roster going into next season, it’s not unreasonable to suspect the team falls below average as offensive rebounders. Westbrook’s proficiency in that aspect would, although not drastically, raise the ceiling for a team like Detroit. They were 21st in field-goal attempts per 100 possessions among teams last season, so to give the Pistons a greater chance at taking some of those shooting possessions back, more offensive rebounding could provide a notable uptick in offensive rating without having to bring in other elite talents.

    Right off the bat, I’d predict Westbrook’s fit as a Detroit Pistons surpasses that as a New York Knick. He gains the right amount of spacing for more room to operate without limiting his free-throw rate as an expense. Westbrook gives more boosts to Detroit’s offensive profile as an offensive rebounder, a free-throw scorer, and as a passer (nearly twice as many assist points created per pass as the Pistons team). We could reasonably expect jumps in scoring rate, due to a more significant role and a strong scoring environment as a member of the Pistons, and assist rate, due to his role as the primary distributor and with teammates of higher floor efficiency than those in New York. Therefore, if I were responsible for trading Westbrook to either Detroit or New York, I would trade him to Detroit. His low scalability wouldn’t be dramatically exploited alongside the teammates he’d have, retaining his stronger offensive impacts in more neutral environments. The Pistons’ offense also showed to be signaling greater potential, and given the impact Westbrook can make on a team of Detroit’s caliber, it’s not unreasonable to argue the Great Lakes State is the optimal suitor for him. We could see a similar increase in offensive rating to that of New York, but with a higher ceiling due to a more suitable situation. Detroit’s offense in 2020, with Westbrook, could be as low as 110 and as high as 112, or a -0.5 to +1 relative offense.

    Charlotte Hornets

    Similar to New York, Charlotte has been thought of as one of the most likely destinations for Westbrook: a team that’s struggling to compete for a Playoff seed without their franchise great, Kemba Walker. There are different ideas on how the acquisition of Westbrook fits the Hornets’ timetable. Are they putting their future on hold taking the burden of Westbrook’s contract and his heavier ball-dominance, or does putting an All-Star on the roster help raise the team’s possibilities? These viewpoints will vary, but it’s hard to deny the attention the media has paid to a potential trade.

    PBPStats

    The Hornets’ shot locations reveal what sets them apart from the two previous teams: spacing. The Knicks provided little to none, and although Detroit was a mild improvement, Charlotte is nearly touching league-average in the spacing metric I cited in the two earlier segments. With three players in the starting lineup with above-average three-point capabilities in Devonte’ Graham, Terry Rozier, and P.J. Washington, Westbrook is granted more than enough space to make a major offensive impact. For reference, his 2017 MVP campaign was done in an environment where defenses reacted “negatively” to the OKC offense, moving inward from the three-point line and toward the paint at an 0.069 increment, or approximately 6.9% closer to the paint relative to the three-point line. Meanwhile, the Hornets had a -0.007 “relative” Spacing. This also gives Westbrook enough defenders in the post to revitalize his more potent free-throw rates.

    Given the on-court structures of the offenses we’ve examined so far, I’d say Charlotte is the best environment for Westbrook to unleash the most of his potential impact. But how do the “goodness” and tendencies of that offense further give Westbrook chances to make a strong improvement in the Hornets’ offensive efficiency? For one, the Hornets are an extremely poor-shooting team from the field, nearly descending to Westbrook levels (50.4 eFG%). This is an area he wouldn’t exactly bolster, but one he’s good enough in that he won’t diminish his teammates’ efforts. A skill in which Westbrook is more of a “middle ground” is three-point frequency. Charlotte had a +0.015 “relative” three-point frequency, hitting them at a 35.2% clip, a few points below league average. Westbrook certainly doesn’t improve these figures with his own efforts, but his stronger role on the team would likely increase the production of his teammates, creating more open and more efficient looks when defenses are scrambling to find Westbrook in the post. As he would the majority of all the offenses we’ll look at, he’d improve Charlotte’s efforts from the charity stripe, but this time at a higher frequency and efficiency. Westbrook gets to and scores from the line at higher rates than the cumulative team results last season. 

    This seems to be a very good option for Westbrook in terms of how his skills would impact the team, but how would he raise the team’s offensive rating and put them in a better position to compete for a Playoff seed? For one, Charlotte had one of the worst offenses in the league last season, posting a -4.3 relative offensive rating, even worse than the Knicks’ efficiency I cited earlier on. It was a mark only the Warriors, a team deprived of offense due to injuries, fell under last year. This isn’t exactly a surprise; the Hornets didn’t have a true offensive anchor with Graham and Rozier running the show, or the strong bench pieces to pick up some of the slack. Therefore, Charlotte would likely be a much better team with Westbrook on the floor given their lack of offensive talent. Westbrook’s fit in the Hornets’ environment and the weaker state of the team lead me to believe he’d mesh better with teammates there than in New York while also providing more offensive value. Next to Detroit, it’s even more clear that Charlotte is in greater need of Westbrook’s impact than one of the more effective offenses in the league, especially one with a returning Blake Griffin. Westbrook’s role in the Hornets’ environment surpasses those of the Knicks or Pistons, but exactly how much better does he make Charlotte? If his efforts in 2021 result in either a low Playoff seed (unlikely) or a few SRS points higher than last season, are his talents really being put to use?

    Earlier, I estimated that Westbrook could provide a rough offensive impact of +0.5 to +1.5 points per 100, and that number would likely hold on a team of similar caliber in Charlotte. But this time, Westbrook’s in a more desirable situation with a more appropriate fit, so how does that value change? The Hornets’ offense is poor enough that I wouldn’t expect an offensive rating above 108 barring any significant teammate improvements. However, I think the floor for Westbrook’s value in Charlotte is also much higher. I’d estimate an offensive efficiency of 107 points per 100 if age starts catching up to Russ and his bandmates plateau. Therefore, I think a trade to Charlotte is the more desirable choice compared to New York, but Detroit is an interesting case. Detroit gives Westbrook the opportunity to anchor a stronger offense without having to pressure the diminishing returns in impact he experiences so often. If Detroit doesn’t improve on defense and Westbrook’s 50th percentile impact comes to play, they could play at a -1.5 SRS level, which would be just outside the Playoff picture for Eastern Conference teams this year. Given the probable improvements of several teams inside that picture like Brooklyn, as well as the ones were observed in teams like Boston and Miami, it’s reasonable to say (barring any major moves in the next few weeks) that the 50th percentile outcome for Detroit would be to miss the Playoffs. I’ll come back to further examine the ramifications of either trade later on.

    Orlando Magic

    Among rumored teams, Orlando was one of the first few to be identified as a potential suitor for Westbrook, and rightfully so. At a quick glance, the Magic are the most intriguing option for Westbrook because of their strong defense and an offense in need of a true engine. They were able to clinch a Playoff seed last season, and the current state of the East suggests they could do it again. Is this a match made in heaven or are there drawbacks to Westbrook potentially joining the Magic?

    PBPStats

    Orlando didn’t have very many creators on its team last season. D.J. Augustin was an adequate primary playmaker, having averaged 6.8 assists per 75 and creating around 7 shots for teammates per 100. Markelle Fultz, Evan Fournier, and Nikola Vučević created around 6, 6, and 5, respectively. But the Magic have yet to acquire a playmaker who can potentially take their offense over the top. Westbrook would’ve been the highest creator on the team despite heavily deflated playmaking numbers. His world-class passing would lift the team’s poor shooting (50.6 eFG%) while he could also make a positive impression with his own scoring. Westbrook’s capabilities as a half-court passer, especially into the post, would create an elite tandem with teammate Vučević, who had a strong gig going with Fultz until the season’s end. Orlando was nearly in the bottom 10% in shot frequency from within three feet of the hoop, and the upgrade from Westbrook’s interior playmaking would encourage both volume and a higher conversion rate in the sport’s most efficient zone.

    Westbrook would round the edges of the Magic’s offense perhaps as well as he would any other. He’d tease minor leaps in free-throw frequency on pace for a +0.041 clip, likely an understatement due to his aforementioned leap in expected free-throw rate. Westbrook fits the mold of Orlando’s low-frequency style from deep, and likely wouldn’t hurt that aspect as much as he would other teams with greater frequencies. But his playmaking, the capabilities of which extend across the court, would improve the team’s efficiency from three as well. Westbrook likely wouldn’t raise the Magic’s three-point efficiency to league-average unless, say, they add some better shooters in the offseason, but the boost he’d give the current roster in this respect could potentially bring their offense to league-average levels. Aside from offensive rebounding, there is the fewest number of skills in which Westbrook’s impact would be of high magnitude, the inverse of several teams preceding the Magic on this list, but the improvements he could bring to their offensive efficiency are strong enough to deem his acquisition a win on the talent front rather than fit, or how he molds and redefines the team’s tendencies.

    How would Westbrook raise the Magic’s odds to succeed? When we look back to an earlier sentiment, as to how Westbrook’s on-court impact could be an intriguing factor while a strong base behind him could limit the magnitude of his on-off splits, it’s hard to say exactly how much better Westbrook’s situation in Orlando would be than that of Charlotte or Detroit. The Magic’s strong defense and a potentially-average offense would lift them to the Playoffs almost certainly, but can we conclude Westbrook would be made the most use of? When it comes to a mixture of how he impacts the team and how the team could succeed, Orlando is the most desirable option of the four. Westbrook’s value may not be as high there as Charlotte, where he’d likely be of the most importance, but the possibility of a postseason berth would put his talents to more use. Westbrook isn’t exactly the smartest trade options given the Hornets’ current timetable. Therefore, Westbrook to Orlando would likely “make the most sense” for both him and the destination.

    Notice how I haven’t considered Westbrook’s defense so far? That’s because it’s a “scalable” trait, one that’s rarely (if at all) affected by team circumstance. Based on last year’s performance, a rough estimate of Westbrook’s per-game defense impact would be -0.25 points. Based on this and the above analysis, how would Westbrook impact each team’s point differential and how would that translate to postseason hopes?

    • NYK (108.3 ORtg | 112.5 DRtg) -4.2 Net
    • DET (110.5 ORtg | 112.5 DRtg) -2 Net
    • CHA (107.7 ORtg | 113.3 DRtg) -5.6 Net
    • ORL (109.7 ORtg | 109 DRtg) +0.7 Net

    Based on these estimates, Westbrook’s skills would really only be put to use on a team like Orlando, one that appears a desirable fit and one that promises the strongest odds of Playoff success. 


  • Advanced Statistics and Plus/Minus Data

    Advanced Statistics and Plus/Minus Data

    Months ago, I wrote an introductory article on the world of composite metrics, the all-in-one figures that attempt to measure a player’s total contributions in a single number. Today, I’ll expand on the concepts discussed in that post to examine the mathematical and philosophical structures of certain metrics and determine the validity of the sport’s one-number evaluators.

    What makes a good metric? The expected response is likely a mixture of how the leaderboard of the statistic aligns with the viewer’s personal rankings and whether the metric includes non-box data for its defensive component. While this may pick apart some of the sport’s “better” metrics, it won’t separate the “good” from the “great.” The advancements of the game’s one-number metrics are far greater than given credit for, and a player’s situational value on his own team can be captured near-perfectly. It’s the nuances of individual metrics that create poor, good, or great measurements.

    Player Efficiency Rating

    PER was the original “godfather” metric in the NBA, created by The Athletic senior columnist, John Hollinger. PER, according to him, “… sums up all a player’s positive accomplishments, subtracts the negative accomplishments, and returns a per-minute rating of a player’s performance.”[1] Although one of the leading metrics of its time, PER receives strong criticism nowadays for its box-only approach. This may seem unjustified, as metrics like Box Plus/Minus are highly regarded with its box-only calculations. PER differentiates itself from a regression model like BPM in that it’s largely based on theory: expected point values.

    Basketball-Reference‘s mock calculations of PER include a factor called “VOP.” Although the author of the article intentionally leaves it vague, I’ve interpreted this to mean “value of possession.” The resulting factor is an estimate of the average number of points scored per possession in a given season. From there, different counting statistics are weighed to the “expected” degree to which they enhance or diminish the point value of a possession. Due to the large inferencing and supposed values of box score statistics, the descriptive power of PER is limited, and the metric is largely recognized as outdated. However, PER provides an accurate and representative look into the theories and values of the early Data-Ball Era.

    Win Shares

    Basketball-Reference visitors are familiar with Win Shares. Daniel Myers, the developer of the metric, states it “… attempts to divvy up credit for team success to the individuals on the team.” [2] Contrary to most one-number metrics, Win Shares don’t attempt to measure a player’s value on an “average” team, and rather allocate a team’s success among its players. Myers took a page out of Bill James’s book with his Win Shares system, which originally set three “Win Shares” equal to one team win. This meant a team with 42 wins had a roster that accrued roughly 126 “Win Shares.” The ratio was eventually changed to 1:1, so nowadays, a team with 42 wins will have a roster that accumulated roughly 42 Win Shares.

    Myers based his offensive points produced and defensive points allowed on a player-rating system developed by Dean Oliver in his novel, Basketball on Paper. The components, Offensive/Defensive Ratings, are highly-complex box score solutions to determine the number of points added or subtracted on either end of the floor. With these figures for a player, Myers then calculates what’s referred to as “marginal offense/defense,” or the number of points a player accounted for that contributed to winning; ones that weren’t negated in the general scheme of a game. Marginal offense and defense are then divided by the number of points the team required to win a game that season. This creates individual Offensive and Defensive Win Shares measurements as well as total Win Shares.

    The Win Shares system, like PER, was one of the strongest metrics of its time. It was one of the first widespread all-in-one metrics that was able to accurately distribute a team’s success among its players: one of the original holy-grail questions in basketball. The main gripe on the Win Shares system is its use of Oliver’s player ratings, which are widely disdained for not passing the criteria listed earlier: the typical “stat-test.” Oliver’s ratings are, in truth, some of the very best metrics that solely use counting statistics; it’s simply displayed in the wrong format. As Oliver states, his Offensive Rating estimate “… the number of points produced by a player per hundred total individual possessions.” [3] We can substitute “allowed” for “produced” to describe his Defensive Rating. The key words in Oliver’s definition are “total individual possessions.” His ratings measure the number of points produced/allowed every 100 possessions a player is directly involved in.

    Resultantly, Oliver’s ratings are best taken as a percentage of individual possessions, or the number of possessions per 100 in which a player is “directly” involved (assisting, shooting, offensive rebounding, turning over). If a player has an ORtg of 110 with an offensive load of 40, his “adjusted” ORtg would be 44, which represents 44 points produced per 100 team possessions rather than individual possessions. I make this remark to remind us all that metrics can be improved upon, added context to, and revitalized. If Myers were to develop a “Win Shares 5.0,” it may be worth examining to “adjust” Oliver’s playing ratings to a less role-sensitive form. The Win Shares system is notably superior to PER in the comparative applications, with far more descriptive power. It may not rank at the very top of the metric echelons, but Win Shares are a fair and moderately-accurate representation of a player’s value to his own team.

    History of Plus/Minus Data

    PER and Win Shares are two of the most successful and/or widespread metrics that quantify impact with expected values, but this ideology slowly began to disappear. What’s the value of a rebound? How many points of an assisted field goal should be credited to the passer? Is a point even really worth one point? These questions of extremely ambiguous and unanswered natures led statisticians to a new viewpoint on quantifying impact: plus/minus data. This involved measuring a team’s performance with a player on the floor rather than weighing the player’s counting statistics. This new ideology, in theory, is the holy-grail perspective we’d need to perfectly pinpoint a player’s value, but statisticians were once again met with interference.

    Traditional Plus/Minus (abbreviated as +/-) measures the team’s Net Rating, point differential extrapolated to 100 possessions, with a player on the floor. But as the statistically-inclined are familiar with, Plus/Minus (also known as OnCourt +/-) is a deceptive measure of value. Poorer players on great teams that faced poor opponents can have massively inflated scores, while great players on poor teams that faced great competition can have dramatically deflated scores. Resultantly, the application of Plus/Minus was a mostly fruitless beginning for plus/minus data, but that didn’t prevent further advancements. With the main deficiency of Plus/Minus being the lack of teammate and opponent factors, there was a clear path to improving on the ideas of plus/minus data.

    WINVAL, a software developed by Jeff Sagarin and Wayne Winston, drew players’ Plus/Minus scores from all of their possessions to evaluate a given player’s impact on different lineups. The system created the building blocks to commence “Adjusted” Plus/Minus (APM), a statistic that takes a player’s Plus/Minus from all of his possessions and accounts for the strengths of opponents and teammates. Without delving too deep into the mathematical processes, APM is drawn from a system of linear equations that includes the home team’s Net Rating during a given stint (one stretch of possessions in which no substitutions are made) as the response variable, the Plus/Minus scores for players as explanatory variables, and recognition as to whether a given player is on the home or away team or whether they’re in the game or not. This gives the calculator the ability to approximate beta-values that results from the series, that being APM in a given game.

    Squared Statistics

    APM “should” have been the holy-grail statistic the world was looking for. It was clear that assigning expected values to counting statistics would nearly always fail, and this new measurement captures changes in the scoreboard without having to distribute credit across different court actions. But (the trend is becoming more and more apparent here) there were still deficiencies with APM that hindered its descriptive power. Namely, it was very unstable, wavering from year-to-year. Its scores also had massive disparities, with excessive amounts of outliers. Dan Rosenbaum was one of, if not the, first to outline an algorithm for APM, and the top player from 2003 to 2004 was Kevin Garnett (unsurprisingly) at +19.3 (surprisingly). We now know even the greatest players in the most inflated situations are rarely worth +10 points to their team, let alone +20 points.

    Jeremias Engelmann, one of the greatest basketball statisticians ever, created “Regularized” APM (“RAPM”) to reduce these poorer effects, another being multicollinearity. If two or more players spend a lot of their time on the court together, they’ll face equally-good opponents and play with equally-good teammates, and APM wouldn’t know to allocate team credit any differently, even between players with great gaps in talent. The mathematically-inclined are most likely associating Tikhonov regularization, or ridge regression, as the primary method to overturn these effects. A ridge regression essentially removes the effects of multicollinearity and “punishes” outliers, regressing them closer to the mean. This process largely improves the massive errors present in APM and paints a far clearer picture of the impact a player has in a given system. Engelmann not only created the closest statistic to a holy-grail metric we have today but further improved its descriptive power.

    Basketball statistics are often associated and influenced by Bayesian inferencing; namely, the use of priors alongside pure measurements to improve year-to-year accuracy and validity. This could be, for example, blending RAPM with the box score, a traditionally-valued set of counting statistics. Engelmann, however, was credited with partiality to previous data in his “Prior-Informed” RAPM (“PI RAPM“). With three or more seasons under its belt, perhaps even just one, PI RAPM is the best measurement we have a player’s value to his team. It not only includes the philosophical perfections of pure APM, but the mathematical validity of RAPM and the benefits of a player’s past to deliver the most valid impact metric we have today. Engelmann doesn’t update his PI RAPM leaderboard often, having last posted a full leaderboard in 2017 (likely due to focus on another one-number metric), but his contributions to improving APM in the 2000s led way to the revolution we recognize as a heap of impact metrics, each claiming importance among its competitors.

    Regression Models

    With Engelmann PI RAPM either proprietary or deep underground, how can we find precise measurements of a player’s value nowadays? Statisticians around the globe have taken advantage of the linear relationships between certain statistics and a player’s impact on the scoreboard to create regression models that approximate long-term RAPM (rather than short-term due to the aforementioned instability of small samples). The components of each metric are what make them different, but the end-goal remains the same: to approximate a player’s value to his team in net points per 100 possessions.

    Box Plus/Minus

    The most popular regression model, likely because it’s displayed on Basketball-Reference, is Box Plus/Minus (BPM). It’s exactly as it sounds: all explanatory variables are box score statistics. Developed by Daniel Myers, BPM estimates value based on four five-year samples of “Bayesian Era” PI RAPM. This differs from, say, Backpicks‘s BPM, which is based on three-year samples of RAPM. There are multiple technical differences between the two, and the yearly leaderboard exhibit those differences. However, Myers’s model is likely the superior of the two, although we can’t be certain because its counterpart has no records of calculation details. But the defensive component in Myers’s appears far stronger than that of Backpicks‘s, and it’s safe to say the BPM available to the public is the strongest option for box-oriented metrics out there.

    Augmented Plus/Minus

    A less-recognized regression model, but one that makes an argument as one of basketball’s best, is Augmented Plus/Minus (AuPM). Developed by Backpicks founder Ben Taylor, it measures a player’s impact with the box score as well as plus/minus data. The explanatory variables were, described by Taylor, hand-picked, and evidently so. More obvious ones are a player’s traditional Plus/Minus, his On-Off Plus/Minus (team’s Net Rating with a player on the floor versus off the floor), and even Backpicks‘s BPM model, as well as teammate plus/minus data for team context. Then there are more separative variables like defensive rebounds and blocks per 48 minutes. This isn’t to say players with proficiency in defensive rebounding and shot-blocking are automatically more valuable, but as the introductory statistics course sets forth, correlation does not equal causation. AuPM was designed to “mimic” long-term PI RAPM, and the metric likely had greater explanatory abilities with those two statistics in the regression.

    Real Plus/Minus

    The aforementioned “other one-number metric” mentioned earlier, Real Plus/Minus (RPM) is Jerry Engelmann’s enigmatic take on blending the box score with plus/minus data to approximate long-term RAPM. The metric sets itself apart in that there are no real calculation details available to the public. All we know with certainty is that RPM is one more in a pile of box score/plus-minus hybrids. Subjected to the intuitive “third-eye,” RPM may not have the descriptive power of some of its successors on this list, but it’s renowned for its predictive power, fueling ESPN‘s yearly projections. RPM has also not been subjected to long-term retrodiction testing, or predicting one season with the previous season, to compare the predictive abilities of RPM to that of other major metrics. However, two things to consider are: RPM was developed not only by Engelmann but Steve Ilardi, another pioneer of RAPM, and the primary distributor of RPM is ESPN, one of the major sports networks in the world. Given the creators, distributors, and the details we have on RPM, it’s safely denoted as one of the greatest impact metrics available today.

    Player Impact Plus/Minus

    The most prominent “hybrid” metric, Player Impact Plus/Minus (PIPM), is also arguably the best. Provided by Basketball Index, the creation of Jacob Goldstein is based on fifteen years of Engelmann RAPM to approximate a player’s impact with the box score and “luck-adjusted” on-off ratings; those being on-off ratings for a player with adjustments made to external factors like opponent three-point percentages and teammate free-throw percentages: ones the player himself can’t control. The product of this was an extremely strong regression model with an 0.875 coefficient of determination, indicating a very strong predictive power between Goldstein’s explanatory variables and Engelmann RAPM. It’s for this reason that PIPM is recognized as one of, if not the, best impact metrics in the world, especially given the publicity of its regression details. 

    RAPTOR

    The product of the math whizzes at FiveThirtyEight is quite the mouthful: Robust Alogirthm using Player Tracking and On-Off Ratings (RAPTOR). It is, once again, infused with the box score as well as luck-adjusted on-off ratings, but two distinct qualities set it apart. RAPTOR includes player tracking data as a part of its “box” component, with deeper explanatory power as to shot locations, difficulties, and tendencies. The other is RAPTOR’s base regression. While the impact metrics earlier in the list use Engelmann’s RAPM, RAPTOR uses Ryan Davis’s RAPM due to its availability that lines up with access to the NBA’s tracking data. RAPTOR is a very young metric, having been around for only one season, and is based on the least “reliable” response variable, being Davis RAPM in place of Engelmann RAPM (but this is for good reason, as stated earlier). RAPTOR certainly has the potential to improve and grow, as evident from the fluctuation of the metric’s forecasting throughout the bubble, considering its great pool of explanatory variables. I wouldn’t bet on the best of RAPTOR as having been seen just yet.

    Player-Tracking Plus/Minus

    Player-Tracking Plus/Minus (PT-PM) is one of the less recognized impact metrics, but certainly one of the most intriguing. It’s exactly as it sounds: calculated from (box and) player tracking data. The metric was created by Andrew Johnson in 2014, a time when SportsVU was the primary provider of tracking data for the NBA. Since then, Second Spectrum has taken over, but it shouldn’t cause any deficiencies to calculate PT-PM in the following seasons. Tracking data that made its way into the regression included “Passing Efficiency” (points created from passing per pass), turnovers per 100 touches, and contested rebounding percentages. The defensive component was more parsimonious, requiring fewer explanatory variables for great descriptive power: steals per 100 and opponent efficiency and the frequency at the rim. These public variables were taken from the beta version of the metric, but the results were very promising. There’s limited information on PT-PM in the last few seasons, but its replication would likely produce another great family of impact metrics.

    So why take the time to invest in impact metrics to evaluate players? For one, they capture a lot of the information the human eye doesn’t, and they do it well. The philosophical premise of metrics like RAPM and its role as a base regression makes the large heap of impact metrics extremely valid, not only in principle but in practice. If we operate under a series of presumptions: a player is rostered to improve his team’s success, and teams succeed by accruing wins, and games are won by outscoring an opponent, then the “best” players have the greatest impacts on their teams’ point differentials. Now, there will always be limitations with impact metrics: they only capture a player’s value in a role-sensitive, team-sensitive context. If a player were to be traded midseason, his scores would fluctuate more than they would if he remained on the previous squad. But adding context to impact metrics through practices like film studies and partiality to more helpful information (like play-by-play data), we can draw the most accurate conclusions as to how players would perform in different environments. 


  • Joel Embiid | 2020 Valuation

    Joel Embiid | 2020 Valuation

    (? The Ringer)

    Four years ago, Joel Embiid was on the verge of being labeled a lost cause. Taken with the third overall pick, a prodigy from the prestigious basketball academies of Montverde Academy and the University of Kansas, he missed what would’ve been the first two full seasons of his career with foot injuries. Nowadays, that’s ubiquitously known as a non-issue, seeing as Embiid is in a deadlocked duel for the title as the league’s top center. Do his strong offense and DPOY-potential defense vault him high enough to claim the spot? And what are the percent odds Embiid gives a random team to win a title?

    Scoring

    Joel Embiid quietly remains one of the league’s top scorers. His standard profile of 23.0 points per game and 59.0 TS% don’t pop out as much as Embiid’s true scoring equity does. Due to a mere 29.5 minutes per game and Philadelphia’s -1.3 relative Pace, Embiid was actually closer to a 28 points per game scorer; during the regular season, he averaged 28.4 points per 75 possessions on +2.5 rTS%. In the Playoffs, those numbers expanded to 31.9 points per 75 on +3.9 rTS%. It’s worth noting Boston’s lack of strong interior defenders in that series, but Embiid’s scoring performances were signs of potential superstardom in the postseason.

    PBPStats

    Embiid’s shot chart dots the efficiency, frequency, and locations of his shooting spots from this year’s Playoffs. Evidently, his relatively broad points of attack suggest Embiid’s monster scoring in the second season wasn’t merely a result of facing poorer paint defenders. Furthermore, Boston’s strong regular-season defense (-3.6 rDRtg), given Embiid’s shot locations, was likely to limit some of his efficiency and volume, neither of which eventually were. His strong post-game was increasingly strong against the 6’8″, 245-lbs Daniel Theis as well. Embiid went to the free-throw line at an insane rate in that series, posting 15.4 free-throw attempts per 75 and 7.97 free-throw attempts per field-goal attempt. Embiid displayed strong tendencies to draw fouls in the regular season, but took it to a whole new level in the Playoffs.

    It’s no secret that Philadelphia’s star center is less proficient at generating offense outside of the post. Embiid often takes ill-advised fadeaways outside of the painted, a surprising note given his converted on an adequate 41% of mid-range attempts in the regular season. He’s also prone to miss driving lanes, eliminating key opportunities for easy baskets. However, in high-effort stints, Embiid isn’t the lethargic, heavy-footed big man he appears to be at first glance. His balance, considering his size, is an indicator of strong momentum shifting.

    Playmaking

    Embiid’s passing is nothing to marvel over. He seldom shows flashes of proficiency in this facet in the post in which he’ll occasionally make an efficient, well-placed pass to an open interior scorer. However, he’s also prone to misreading handoff opportunities, and with screening action as a focal point of Embiid’s offense, it’s reasonable to suggest his passing hurts Philadelphia more than it helps. Embiid’s Passer Rating, a numerical estimate of passing quality, was in the 34th percentile in 2020. It’s also estimated he’s a negative-impact playmaker, contributing fewer than zero points per 100 in that manner. There are some positive indicators of Embiid’s creation. He opened more than six extra shot opportunities for his teammates every 100 possessions in the regular season; however, it’s also a figure that dipped over three points in the Playoffs. It’s unlikely Embiid will ever strengthen a good offense with his playmaking abilities.

    Off-Ball

    During the possessions in which Embiid isn’t “meaningfully” involved in the 76ers’ offense (~ 55% of possessions), he provides solid off-ball value. As his role as big man implies, a large part of Embiid’s off-ball repertoire is screening action up top. He’s a “dual-threat” screeners in this manner, displaying proficiency in both the interior and on the perimeter. Embiid is a strong pick-and-roll screener with a solid regime running with teammate Ben Simmons. However, Embiid’s off-ball specialty lies closer to the glass. He’s one of the game prominent offensive rebounders, grabbing 10.3% of available opportunities and 3.4 per 75 possessions. It isn’t merely a product of his 7-foot, 280-lbs frame either; Embiid is extremely active on the offensive glass. It’s arguably his strongest point of engagement and one of the areas Embiid thrives in. He’s prone to the occasional flop, wildly exaggerating contact near the basket, but his off-ball value is enough to keep afloat as an interior-specialist center. These qualities wouldn’t fit especially well alongside strong teammates.

    Offensive Summary

    Impact metrics are fairly split on Embiid’s offense. Play-by-play-infused metrics clearly grant the lower end of the stick in terms of offensive impact. For example, Basketball Index‘s PIPM and FiveThirtyEight‘s RAPTOR both denote Embiid’s offense as worth less than 1.1 net points per 100 possessions. However, these results are likely due to some extremities. Philadelphia’s offense improved by +2.6 points per 100 with Embiid off the floor, skewing some of these results. Box score estimates paint a fairer picture of his offense. Basketball-Reference‘s Box Plus/Minus measures Embiid’s offense at +3.7 while my own Box Plus/Minus model estimates that value at +3.4 in the regular season and the Playoffs. Embiid is not an offensive superstar, but his strong scoring is enough to propel him near the top of the pack in the major impact metrics.

    Defense

    Despite a high defensive valuation for Embiid, I’m fairly critical of his team defense. At times, he’s too post-oriented, opting to leave strong perimeter threats open without a paint presence to justify. Although Embiid has that strong frame that we examined earlier, he doesn’t always stay in front of his matchups. He also falls back too immensely on strong-shooting matchups, leaving several open floaters. There are also questions on his focus. Embiid seldom ball-watches, loses players who don’t have the basketball in their hands, and lacks the general defensive attentiveness to maintain consistent off-ball value.

    Conversely, the qualities that make Embiid one of the league’s premier defenders are also apparent. He shows strong passing anticipation; and although he isn’t the strongest and jumping and clogging passing lanes, his reaction time counterbalances some of his slower movements. Embiid is one of the strongest paint presences in the league, having blocked 3.7% of available two-pointers in the regular season and 3.2% in the Playoffs. Paired with a sturdy stature and strong vertical movement, Embiid is one of basketball’s most dominating post defenders. Despite this paint-exclusiveness, Embiid’s value in the Playoffs remains relatively similar. Research done through Thinking Basketball suggests interior-oriented defenders lose large amounts of value in the Playoffs, while Embiid retained nearly all of his (2.3 D-PIPM in the Playoffs).

    Defensive Summary

    Impact metrics regularly view Embiid as one of the game’s strongest overall defenders. Box score estimates are less sensitive to his value due to a declining block rate and a stagnant steal rate; Basketball-Reference estimates his per-100 defensive impact at +1.0, Backpicks argues it’s barely over half a point, and Cryptbeam DBPM clocks that figure in at +1.4. Conversely, plus/minus hybrids value Embiid’s defense significantly higher. His three-year LA-DRAPM is a tick under +5, a clear overstatement compared to his scores in D-RAPTOR (+3.6), D-PIPM (+2.29), and DRPM (+2.00). Embiid’s post tendencies lead me to believe his defensive impact is inflated in pure impact measurements (RAPM), which is still good enough to denote Embiid as a strong All-Defensive level player.

    CPA Valuation

    Joel Embiid would provide a random team an increment of approximately 12.11% odds to win a championship. 


  • A Statistical Guide to 3-Point Proficiency

    A Statistical Guide to 3-Point Proficiency

    (? The Ringer)

    Tony Bradley, Drew Eubanks, and Johnathan Motley. What do these three players have in common? They each made 100% of their three-point attempts last season. Therefore, they must be the league’s best three-point shooters, right? No, of course not. Although the word “best” can have varying connotations here, it’s hardly appropriate to say three players who shot no more than 1.2 threes every 100 possessions were the best three-point shooters of the year. It’s been clear for a long time that conventional three-point percentage is, in essence, not a perfectly-indicative measurement. It pays no attention to the frequency at which a player shoots three-pointers. This has been combated with mental filtering for a while now, but what if there were a method to balance efficiency and volume in three-point shooting and condensed into one number?

    Patrick Miller at Nylon Calculus tried to answer this question, specifically for college basketball players, to predict their three-point percentages in the NBA. His “Bayesian 3P%” was a success, appropriately pinpointing the three-point proficiency of college stars while providing accurate estimations of NBA percentages. Millers’ strong methodology and strong results had me thinking about the applications of Bayesian statistics in the NBA, and how they could improve the traditional measurement of three-point percentage, the result being a “prior-informed” three-point percentage or PI 3P%.

    Methodology

    As stated earlier, the goal of PI 3P% was to find a balance between efficiency and volume from beyond the arc to create an “adjusted” three-point percentage that accounts for a player’s shooting volume from that range. I retained the essence of Bayesian statistics in PI 3P% with the use of priors: previous beliefs on a subject used to improve the raw data, ours being three-point percentage. To do this, I regressed (logarithmically) the last twenty-five seasons of three-point attempts onto three-point percentage to provide a foundation for the prior; thus, accounting for diminishing returns on higher frequencies under the impression that three-point percentage becomes more and more indicative as a player takes more and more shots. All data in the regression were adjusted to “per-100.”

    With the prior, I was able to estimate a player’s three-point percentage based on how often he shot from that range. The next step was to merge a player’s actual percentage with his expected percentage, but I also had to decide to how great a degree the latter would be weighed. This process was simply a lengthy test of observing how percentages change with different weightings and comparing residuals against three-point attempts. If the weighting was a success, then the residuals should decrease as attempts increase (below). 

    From a sample of last year’s data, we can see there’s a typical decrease in adjustments as a player’s frequency from three-point range increases. The prior serves the purpose of negating extremely-high percentages on low volume but also reduces the effects of anomalous results. Dusty Hannahs of the Memphis Grizzlies converted on 67% of his 10.8 three-point attempts per 100 possessions, a mark that lowers to a 46% prior-informed three-point percentage. This is an extreme instance, of course. Players’ updated three-point percentages will continue to represent great-shooting seasons with minor luck adjustments. That being said, adjusting for luck does not extend to playing time. Hannahs, the league’s leader in prior-informed 3P% last year, played a mere 13 minutes the entire year. PI 3P% is a descriptive statistic to measure a player’s three-point proficiency during his time on the court. 

    With our prior-informed 3P% up and running, can we still reasonably state the original trio of Tony Bradley, Drew Eubanks, and Johnathan Motley represents the league’s best distance shooters? This model strongly disagrees, with no player of the group posting a new percentage higher than 28%. Instead, we can select a new group of players in place of them. For players who were on the court for at least 1500 minutes last season, the top shooters in PI 3P% are:

    1. Duncan Robinson
    2. J.J. Redick
    3. Dāvis Bertāns
    4. Buddy Hield
    5. Seth Curry

    This group is far more representative of the league’s top distance scorers, each of them having shot at least 9.8 attempts per 100 with an efficiency of at least 39%. Meanwhile, Tony Bradley, the sole member of our original trio to make the Playoffs, fell to 0% in the second season. With a prior-informed three-point percentage, we can reduce the need for mental filtering in determining the league’s best three-point shooters.

    The database for PI 3P% can be found here.


  • Jrue Holiday | 2020 Valuation

    Jrue Holiday | 2020 Valuation

    (? The Ringer)

    Is it fair to say New Orleans’s Jrue Holiday is underrated at this point? He’s had several instances of strong recognition in his career, including an All-Star appearance and two All-Defensive Teams, as well as praise following his twenty points per game season last year and a great display of defense against Damian Lillard in the 2018 Playoffs. However, question marks have been raised about the validity of his impact. Holiday’s luck-adjusted RAPM in the last three years has been higher than all but one player in the NBA. The dichotomy of his lesser forms of recognition versus supposed impact led me to set out to answer an important question surrounding his true value: what are the percent odds Jrue Holiday provides a random team to win a title?

    Scoring

    Holiday’s scoring is one of the strongest indicators of his role: the offensive engine of a moderate offense. Although he plays the shooting guard position, Holiday acts like a point guard in the Pelicans’ offense. He’ll often receive the rock at the perimeter, specializing in either the wings or up top. Holiday typically attacks the basket with very slow drives. He sizes up the defense instead of immediately penetrating to the rim, and this action spurs ball movement on the perimeter and improves New Orleans’s playmaking, as we’ll examine later on. Holiday is exempt from his less pressurized drives by his agility near the hoop. He’s neither particularly explosive nor quick, but his ability to maneuver his hips and sides creates several shots in the paint. However, Holiday converts on a mere 59% of attempts at the rim with his lowest efficiency from within three feet of the rim in three years.

    Particularly unique to him in a group of elite NBA players, Holiday rapidly declined in scoring efficiency from last season. He surged in the category from the 2017 to 2018 seasons, posting a +1.4 rTS%, a +3.5% increment from the previous season. The season afterward, Holiday was just below league-average at -0.2%. During 2020, that figure dropped to -2.4%. What created this mostly unforeseen deterioration in scoring efficiency? If we look at his shooting locations in each of the past two seasons, a clear trend emerges that may explain some of Holiday’s shooting deficiencies.

    2018-19 season

    2019-20 season

    Provided by PBPStats, there are two clear distinctions between the two charts: Holiday’s lack of efficiency in the paint and mid-range attempts in the 2020 season. Perhaps there is a “poor-luck” nature to his woes in the post; Holiday’s efficiency from within three feet of the hoop is the lowest it’s been in the last three seasons. However, considering Holiday’s efficiency in that range this year would surpass each of his marks from his first eight seasons, it’s safer to refrain from a “poor-luck” perspective. Rather, it’s more likely Holiday’s efficiency is stabilizing after two anomalous seasons in the paint. Due to his subpar efficiency and volume that doesn’t compensate for the missed opportunities for his shots, I wouldn’t recognize Holiday as a “good” scorer in the NBA, but his attributes in this facet contribute toward a larger range of team offense.

    Playmaking

    Holiday’s ability to engineer an offensive is done through his creation and passing rather than his scoring. His aforementioned tendency to start with slow drives toward the paint often spurs the action of the Pelicans’ offense. When Holiday positions himself near an elbow, just outside the paint, his presence is enough to draw defenders from the perimeter inward, as if the middle of the paint is the center of a gravitational force acting against opposing defenders. Holiday’s creation is largely due to his ability to unclog the corners, two spots at which New Orleans frequently positions shooters to take advantage of Holiday’s strengths. His constant ability to carry out this series of events makes up a large portion of his offensive value and points toward his contributions as a creator.

    Although he’s not the highest-quality passer in the world, Holiday is still capable of hitting tougher spots in pressurized situations. New Orleans’s passing on the perimeter is among the league’s best, and Holiday’s creation is the initial force behind it. If it weren’t for Holiday’s selective creation, his offensive value would be far lesser. It was enough to grant him a Passer Rating upward of seven on the one-to-ten scale, continuing his statistical trend of high-quality passing. Holiday’s playmaking was worth almost three-quarters of a point per 100 according to Backpicks‘s “PlayVal,” but I think that measurement undermines his capabilities as an offensive funnel through his creation and passing. Due to Holiday’s declogging and perimeter action, I’d denote him as a “very good” playmaker in 2020.

    Off-Ball

    Holiday’s value off the ball is almost exclusive to the perimeter. Given his role as more of a point guard to the Pelicans, he’s frequently required up top to initiate facilitation or score in the post. Resultantly, it’s uncommon to see a consistent string of possessions in which Holiday makes a significant impression in the paint without the rock in his hands. Although his preference of the arc may seem a deficiency at first glance, Holiday provides a number of positives on this front. Despite his 6’3″, 205-pound frame, he’s an effective screener on the perimeter, and similarly a proficient pick-and-roll screener. Holiday plays an extremely active role up top. During conservation situations, he’ll plant himself at a corner, a schematic New Orleans’s offense displayed throughout the season. Holiday’s adequacy as a shooter (35.3% from 3) makes him a great option for the Pelicans in these spots. He may not provide the distinct value of a Stephen Curry or Reggie Miller, but Holiday’s off-ball value is of use to a multitude of offenses.

    Defense

    Holiday’s case as one of the league’s top guards relies on his defense. He plays a low-risk style of defense that minimizes errors. Holiday’s most frequent mishaps, missing deep cutters and flat-footedness in transition plays, are very rare occurrences on the court. His far more prevalent strengths are prominent either on or off the ball. When he’s directly guarding a matchup, Holiday has some of the strongest positionings of any guard in the league. His strong mix of upward and downward stances to match the angle of his opponents cause some of the strongest commotions a 6’3″ guard could do. Holiday consistently staggers offensive sets, denying penetration attempts additionally with his great hands. This is largely in part due to an optimized armlength radius, keeping opponents far enough at bay to prevent foul trouble but close enough to prevent easy drives. As evident from his 1.7 steals per 75 possessions, his pickpocketing capabilities are near the top of the league. Paired with strong defensive coverage, especially on the perimeter and in recovery, Holiday is one of the very best defensive guards in the NBA today.

    Summary

    Impact metrics have a large variance but a stable typical picture of Holiday’s value. His aforementioned luck-adjusted RAPM was second in the entire league. Holiday’s minimum comes from Goldstein’s PIPM at +1.73 per 100 possessions. With an offensive impact typically ranging from 1.5 to 2 points and a defensive impact usually worth 0.5 to 1 point per 100, Holiday’s situational value is mostly stable aside from his RAPM-esque outliers. Play-by-play data certainly paints a greater picture of his value than the box score, and pure situational value argues he’s among the league’s best. However, due to his declining RAPM (+1.4 in 2020), it’s likely a three-year sample is too partial to earlier events. Based on evaluations of Holiday’s offensive and defensive values, I’d denote him as an “All-Star level” player in 2020 and estimate Jrue Holiday provides a random team with 7.7% odds to win a title at full health. 


  • Jamal Murray | 2020 Valuation

    Jamal Murray | 2020 Valuation

    (? The Ringer)

    Jamal Murray was already showing strong signs of improvement coming into the bubble. He’d taken on an increased load, with notable increments in usage rate and offensive load. More importantly, Murray had started doing more in his time on the court. However, the Playoffs painted a new, renowned picture of Murray’s potential. He exploded in the postseason, with drastic improvements in scoring volume, efficiency, creation, and offensive rebounding. Murray’s stellar performance in the second season left questions as to whether the stint was merely a fluke or an indicator of seasons to come. I’ll attempt to provide an answer to the questions surrounding Murray’s game and determine the overarching principle of my player valuations: what are the percent odds Jamal Murray provides a random team to win a title?

    Scoring

    Murray’s scoring is largely built around his role as an on-ball driver. For the first time in his career, his usage rate exceeded 25% and his offensive load has exceeded 40%. Murray functions well up top as Denver’s primary pick-and-roll ball-handler, a tandem he enacts with teammate Nikola Jokić as one of the most effective routines in the team’s offense. Murray will use these opportunities to search for shot opportunities at the perimeter or in the mid-range. His highly-effective step-back move is one of the driving points of his superb mid-range scoring; Murray converted on 46% of his 7.4 attempts per 75 from that range. In the Playoffs, he continued this strength and used it to punish the Lakers’ strong defense. Murray improved from every single one of Basketball-Reference‘s primary shooting ranges from the previous season, an indicator of his growing efficiency.

    Interestingly, Murray has had an up-and-down track record with scoring efficiency. His True Shooting percentage has been below league-average in three of his four seasons, with the exception in his sophomore year: a product of improved efficiency from two and three-point ranges. In 2020, that mark was a -1.1 rTS%. Murray was the most efficient from inside the arc as he’d been in his career, but subpar distance shooting (34.6% from 3) saw a dip in overall efficiency. However, Murray’s efficiency took an unprecedented leap in the Playoffs, coming in at +6.7% greater than league-average, despite facing three tough defenses in the Clippers, Jazz, and Lakers. If we examine Murray’s shot charts from the regular and postseasons, there are identifiable trends.

    Regular Season

    Playoffs

    Provided by PBPStats, we can see the diversity of Murray’s shot locations decreased from the regular season to the postseason. It can either be attributed to 1) fewer opportunities to expand his locations or 2) a higher dependency on the two most efficient ranges: the perimeter and the paint. There’s a clear decrease in mid-range frequency, especially near the corners. Murray’s mid-range proficiency allowed for less hesitance closer to the free-throw line, but his heavier reliance from three (where he shot 45%) and the rim (where he shot 66%) created drastic changes in his efficiency and volume. For reference, Murray had a ScoreVal (an estimate of points per 100 from scoring) below zero. In the Playoffs, that figure nearly reached 1.5 points, the tenth-highest score in the second season. Murray’s regular-season volume and postseason scoring will likely propel him to All-Star status, but his regular-season efficiency will play a large role in the future of his career. My recommendation: prioritize the ranges he excelled in during the Playoffs, the paint and the perimeter, and cut down on mid-rangers near the corners.

    Playmaking

    Murray is also one of the league’s better passers and playmakers. During the regular season, he showed promising results on that end with solid transition play and the ability to open up the corners: two prominent spurs of Denver’s offense. The only true knock against Murray’s regular-season passing was a slight lack of recognition in certain plays. There were spots in which he was positioned to split the defense with a bounce pass to a roller, yet Murray would refrain. All things considered, he was a very good playmaker in the regular season, creating around eight shots for teammates every 100 possessions with a Passer Rating eclipsing the six-mark. Murray’s postseason playmaking, however, reached an elite level. Although his Passer Rating was identical to his regular-season mark, the figure doesn’t do justice to how good Murray’s passing was in the second season. This more engaged version of Murray was a near-elite playmaker, creating upward of twelve extra shots every 100 and converting on extremely difficult attempts.

    His regular-season playmaking was summed up in his PlayVal, an estimate of points added per 100 from playmaking, which came it over half a point. Already a good mark for Murray, similar to his scoring, his postseason playmaking became elite. Instead, he was contributing nearly 1.5 points every 100, which, similar to his Playoff ScoreVal, was one of the best scores in the entire league. Here, an old question arises: was this postseason jump a fluke? I’d hesitate to say it was; Murray’s passing was certainly better, but it seemed more a product of engagement rather than a lucky burst. His creation doesn’t receive the exact same treatment; some of his proficiency was aided by strong scoring, which is more likely a product of luck. However, it isn’t unreasonable to state Murray is a good, or even very good, playmaker in 2020.

    Off-Ball

    Similar to the league’s group of on-ball guards, Murray doesn’t provide a whole lot of value without the ball in his hands. This isn’t to say he goes so far as to idle on the perimeter like James Harden. Rather, Murray anticipates regaining the ball in these spots. He’ll often run the ball down the court, after which he’ll snap a quick pass to a teammate on the perimeter and come down near a corner. If Murray doesn’t try any screening action to open a teammate up near the top of the perimeter, he’ll often run a back-and-forth route back up top to get the rock. Murray targets potential screeners on the perimeter for handoffs and a quick path to attack the basket. He’ll rarely find himself camping out in the post, but an elbow isn’t uncommon. These deeper plantings allow for teammates to screen against Murray’s defender, open up Murray, and get him back up top to run some more offensive action. Denver has a great system built around Murray’s lack of elite off-ball value, allowing him to emphasize his strengths and contribute the most he can to the scoreboard when the ball isn’t in his hands.

    Defense

    Murray is a 6’4″ guard with a 6’6″ wingspan, so without the face value physical traits, his defense would come across as underwhelming. However, the value he brings on the defensive end doesn’t seem to hurt Denver’s defense at all; in fact, it may even help slightly. Murray’s defense has minorly fluctuated over the length of the season, but the aggregate of all his efforts paints a good picture of his defensive capabilities. For example, he shows good hands and hand placement, often finding smart steals opportunities in slowed fastbreak plays. Murray stole the ball 1.3 times every 75 possessions in the regular season. He also has surprisingly strong positioning. Against strong centers like Joel Embiid, Murray was able to keep his matchups in front with planted feet and an upright stance. He’s also a good switch defender, making more automatic rotations than a typical guard. Murray recognizes the need for perimeter coverage as well, and doesn’t fall under the typical umbrella of guards leaving at least one perimeter threat open. I’d argue Murray is a neutral-impact defender in 2020.

    Summary

    Impact metrics are fairly indicative of Murray’s true value. His offense is typically valued at around two net points per 100 in the regular season, and even higher in the Playoffs. I wouldn’t argue with these scores too much, although Murray’s role as an on-ball talent leads me to believe he wouldn’t experience lesser diminishing returns alongside greater teammates. His defensive scores are also relatively stable. It’s mostly evaluated as neutral in impact, with anomalous scores from metrics like RPM (+1.31 DRPM). It’s worth noting RPM grants Murray a score of -0.39 on offense, without a doubt a large question mark. However, his impact is appropriately represented through impact metrics. I’d estimate Jamal Murray provides a random team with 6.86% odds to win a title at full health.


  • Klay Thompson | 2019 Valuation

    Klay Thompson | 2019 Valuation

    (? The Ringer)

    Praised for his two-way play and world-class marksmanship, Klay Thompson was often drowned out in a sea of offensive stars in Golden State. Despite five consecutive All-Star appearances, he was the Warriors’ third option on offense. Thompson’s status as a tertiary offensive weapon hindered the recognition he would receive, but the development of title odds metrics have demonstrated the importance of second-and-third stars. Today, I’ll tackle questions like the true value of Thompson’s offense and defense to estimate the overarching principle of my player evaluations: what are the percent odds Klay Thompson wins a title on a random team?

    Scoring

    Despite a limited involvement in Golden State’s offense (offensive load ~ 33%), Thompson was one of the league’s most effective scorers. He provided strong options in the three main regions of scoring: the post, the midrange, and the perimeter. Thompson was successful on 72% of his attempts from within three feet of the hoop and didn’t shoot lower than 42% from any of Basketball-Reference‘s primary shooting ranges. He had a moderate dip in three-point efficiency compared to his previous seasons: 40.2% in 2019 down from 44% the season before, the main factor in Thompson’s declined overall efficiency (-2.8 rTS% from 2018). However, this was mainly a product of early-season struggles; Thompson raised his three-point efficiency to 44% in the Playoffs.

    As the lethal shooter he is, Thompson thrives on step-back opportunities. He doesn’t maneuver the way most elite step-back shooters do, like Luka Dončić or James Harden. Thompson’s movement is largely directed from one baseline to the other, a vertical motion rather than horizontal. He’ll often be running toward the hoop with the ball in his hands and quickly shift his momentum backward, snapping a shot multiple feet behind his defender. This unorthodox path of movement also makes Thompson a great driver. Aided by his 6’7″ frame, exceptional for a guard, Thompson is a solid post-up option to keep up with larger wings. Although a hesitant dribbler at times, Thompson would function as an adequate secondary or tertiary pick-and-roll ball-handler. His ability to exploit a defense’s horizontal spacing, the spacing between two staggered defenders, opens up the corners for shooters and either side as a driving lane for the roller.

    Thompson was one of the league’s greatest tertiary scorers in the league, averaging 22.6 points per 75 possessions on +1.4 relative True Shooting. The latter measurement is not the most indicative figure of Thompson’s efficiency as we examined earlier. In the Playoffs, he rose to +1.9% in the efficiency department, still an underwhelming figure. However, considering his two-point efficiency dropped 5.4% in the Playoffs, it’s clear there are some confounding variables working against Thompson here. At an average strength, let alone full-strength, Thompson is still one of the league’s most efficient shooters and scorers. According to Backpicks‘s ScoreVal metric, Thompson’s scoring added fewer than 0.5 points every 100 possessions. However, considering his aforementioned efficiency troubles, his actual value would most likely exceed that benchmark. Thompson’s high-volume, high-efficiency style paired with historical shooting makes him an elite scoring option in Golden State’s offense.

    Playmaking

    Thompson never has, and likely never will be an above-average creator and passer. His limitations are very clear, especially in the half-court. Thompson will pick up his dribble and be forced to make a close pass near a block, and in those spots, he displays some concerning accuracy. We’ve seen this during the entirety of the 2019 season: Thompson struggling to generate efficiency half-court offense with his passing. Throughout his career, Thompson has never had a Passer Rating less than 4.2 or greater than 5.1, perhaps a mild overstatement, but the measurement largely captures the quality of his passing. Thompson is also an unimpressive creator. Defenders would often leave Thompson often despite his presence on the perimeter. However, it’s fairly clear and worth noting that those defenses had more trouble than usual: Curry and Durant. As a result, I’m willing to state Thompson’s “true” creation is understated by his situation. He’s created around 4 to 4.5 shots per 100 in the last four seasons.

    As a member of the Warriors, Thompson has provided neutral to slight-negative value as a playmaker. Backpicks‘s PlayVal estimates Thompson’s point-contribution as a playmaker has been below zero since the 2016 season. However, as we examined earlier, this is in large part a product of Thompson’s situation. If he were in a neutral setting, Thompson would likely be neutral to a slight-positive playmaker. The quality of his passing, a characteristic that isn’t affected by situation, hinders Thompson from “good” playmaking status. His creation would likely improve alongside more typical teammates with an increased role as a ball-handler and a larger threat to defenses, and as a result, I’d label Thompson as a “neutral” playmaker in 2019.

    Off-Ball

    Similar to his two previous skills, Thompson’s off-ball value is overshadowed by the likes of teammate, Stephen Curry: one of the greatest off-ball scorers of all-time. Thompson displays his own fair share of calculating movement. Contrary to Curry’s arsenal of screening action and quick darts across the court, Thompson relies on his lateral movement. His strong hips that aid him as a man defender allow him to quickly change direction and faze defenders. Resultantly, Thompson will often find himself an open look at the perimeter, where his more enveloped role in Golden State will provide Thompson with an open shot. He also separates himself from Curry with his off-ball value in the post. Thompson is far more likely to be seen camping out by or cutting through the baseline, locating post-up opportunities, and funneling through as an offensive rebounding option. Thompson’s value off the ball adds to his elite scalability and impact as an offensive player.

    Defense

    Thompson fills a much-needed role in Golden State as the defender of the opposing team’s best offensive perimeter player. His aforementioned size plays a key role in Thompson’s containment of the league’s premier offensive stars. He’ll often match drivers in a running motion rather than a display of lateral movement, as we saw in his offense. This quick movement and swivels of the hips allow Thompson to keep up with faster guards approaching the paint. At times, Thompson will even stagger the penetrator before the latter can pass the charity stripe. His value as a team defender is far less apparent, but there are a number of positives accredited to Thompson’s name. As a taller guard, he can protect almost every spot on the court, as we see when he shuffles to the interior from up top to protect the paint from rolling forwards. As a result, Thompson is a very solid paint presence. With minimal errors in his defense, the only noteworthy ones being the mild tendency to ball-watch on coverages and some low-recognition plays, Thompson is a large positive on defense as a guard.

    Summary

    Contrary to popular opinion, impact metrics paint a very poor picture of Thompson’s value. His lower scores in the 2019 season include a PIPM of +0.26, a RAPTOR of +0.14, and a three-year luck-adjusted RAPM of +0.96. Then there are extremities like his -0.3 in Basketball-Reference‘s BPM and a -0.33 RPM. However, it’s worth noting impact metrics (except RAPM) are calculated with 1) the box score and 2) luck-adjusted on-off ratings. Thompson doesn’t exactly fill the stat sheet with assists, rebounds, steals, and blocks, and he’s gotten the shorter end of the stick in on-off totals. Golden State’s defense was 4.4 points more efficient with him off the floor and their offense was only a point-and-a-half better with him on the floor. Prorating these scores to a “neutral” environment and examining his impact across a variety of settings, I’d estimate Klay Thompson provides a random team with an increment of 9.13% odds to win a title at full-health.


  • Top 10 NBA Players of 2020

    Top 10 NBA Players of 2020

    (Cryptbeam)

    Ladies and gentlemen: it’s officially the most wonderful time of the year. Not because of Christmas, of course, but because it’s an ideal time to evaluate the league’s best players. With the Lakers’ game-six victory against the Heat closing the book on the 2020 season, now is the perfect time to reflect on basketball’s top talents; and what better way than with a top-10 list?


    Rationale

    This list intends to connect a player’s worth to a team’s ultimate goal – to win a championship. Therefore, the “best” players bring a team closest to a title. However, this isn’t a measurement of situational value, or how valuable a player is in his specific role on his specific team. I’ll look to connect a player’s “true” value, or how he’d impact a wide variety of teams, with increments in title odds. Resultantly, the placements on this list are partial to a trio of “portable” skills, or certain attributes that maintain value alongside better teammates: defense, passing, and shooting. The qualities of my criterion are similar to those of the CORP methodology because of a shared common goal: to, as stated earlier, connect a player’s value across a variety of environments to the degree of championship lift he provides.

    (Click here for a deeper review of my methodology)

    Disclaimer: This ranking does not assume all players are healthy. For example, if a player misses 2 of his team’s 10 postseason games, that player is credited with 80% of his full-heath championship equity in the Playoffs.


    10. Damian Lillard

    Lillard vaulted himself into the conversation as one of the league’s greatest offensive players this year. His lethal scoring repertoire, which consists of elite screen action, defensive spacing exploitation, and perimeter play resulted in an impressive 28.5 points per 75 on nearly +6.5 relative True Shooting. Lillard’s instrumental playmaking was a large asset for Portland, creating around 15 extra shots for teammates every 100 possessions. He doesn’t provide a ton of value off the ball, and Lillard’s postseason offense was clearly inferior to his regular-season self. Lillard’s defense is also problematic. His deep coverage and transition efforts make it hard to argue he’s a positive on that end, but the general premise of Lillard’s offense earns him a spot on this year’s list.

    9. Jimmy Butler

    Butler’s postseason play was the deciding factor in his spot on this year’s top-10. He maintained a decent scoring attack of 22 points per 75 on moderate efficiency in the regular season, but the latter’s Playoff changes were an influential factor in Miami’s Finals run. Butler improved by nearly five percentage points in the True Shooting department, enough to make his Playoff scoring elite. His facilitation drastically improved once separate from a drowned-out role in Philadelphia. Butler improved by four extra shots in the creation department, a figure he maintained in the second season. Butler’s great defensive impact, a mixture of low-error play, good positioning, and strong hands are of high worth to NBA rosters. His anchoring of a great postseason offense and perennially-strong defense made him a newcomer in my latest top-10 list.

    8. Nikola Jokić

    Jokić was nearly identical to his previous-season self: identical scoring and (adjusted) turnover rates and slightly higher efficiency and creation. Similarly, his 23.6 points per 75 and +3.7 rTS% in the regular season rose to 25.8 and +5.5 in the Playoffs, respectively. Jokić’s postseason change was on perfect display with his three-point efficiency, which vaulted to 43% on 5.4 attempts per 75. He continued his highly-effective “bully-ball” and perfected his pick-and-roll routine with teammate Jamal Murray. Jokić’s defensive remains the subject of criticism; his honey-bear build and slow feet don’t amplify his team’s defense. However, his quick reaction time and smart hand placements keep Jokić’s head above water in terms of defensive impact. Jokić’s role as a strong offensive cornerstone is applicable to a wide variety of teams, which paired with adequate defensive impact, makes Jokić one of the most equitable players in the league today.

    7. Luka Dončić

    Luka Dončić, in a season in which he was surely robbed of the MIP Award, took his offensive game to another level. Dallas featured the most efficient offense in league history, posting a 117 Offensive Rating in the regular season. Dončić’s having anchored that offense is a strong indicator of how good his offense is. He was near the top of the league in scoring rate, 31.1 points per 75, which he matched in the postseason, on stronger efficiency against a tough Clippers defense. Dončić was the true centerpiece of his team’s offense; he was “meaningfully” involved in roughly two-thirds of his team’s possessions. His offensive attacks, step-back jump shots, foul-drawing, and tough-shot making contribute to his world-class offense among a plethora of on-ball habits. Dončić’s defense is nothing to be impressed with: mediocre positioning, man, and off-ball defense, but his offense is enough to propel him safely onto this year’s list.

    6. Joel Embiid

    Embiid was quietly one of the league’s top players this season. He had a strong season as a scorer: 28.4 points per 75 on +2.1 relative True Shooting, which grew to 31.9 and +3.9 in the postseason, respectively. Embiid is a strong bully in the post with solid feet under the right care, which paired with undervalued passing and creation, makes him a strong offensive anchor in the post. However, the aspect of Embiid’s game that separates him from the players ranked below him is his defense. Embiid is antithetical to Butler in that his defense is more prone to error, but the benefits are of far greater return. He’s an extremely strong paint presence (career 4.8 block percentage) with solid pass anticipation, which paired with his maintained value in the Playoffs, sets Embiid apart from the rest of the pack. His strong post offense and world-class defensive impact are deciding factors in Embiid’s placement.

    5. James Harden

    James Harden continued his trend as one of the league’s elite offensive weapons in 2020. After posting the highest scoring rate in league history in 2019, Harden remained near the top of the leaderboards at 33.2 points per 75 possessions on high efficiency. In the Playoffs, his volume dropped to 29.3 points per 75, but his increased efficiency argues Harden had his best-scoring season in the Playoffs this year. His creation rates were consistent with the league’s top marks, exceeding 15 shots created per 100 in the regular season and 12 per 100 in the postseason. If Harden’s offense were more scalable or he provided more off-ball value, he would ubiquitously rank as the league’s top offensive player. However, given the “true” value of his offense and subpar defensive efforts, Harden comes in at fifth this year.

    4. Kawhi Leonard

    Leonard had one of his strongest regular seasons in 2020. He entered the upper echelons of scoring at 30.4 points per 75 on respectable efficiency. Leonard’s creation made a clear leap from last season, rounded at 11 shots created per 100. There were still instances of hesitance on Leonard’s passes, and it’s likely his playmaking estimates are a tad overrated, but his distinct improvements on that front gained him some offensive territory. Leonard’s defensive impact will likely never match his defensive talent as the two did earlier in his career, but Leonard remained one of the league’s top wing defenders in a mix of excellent hands, a prominent ability to clog passing lanes, and solid tracking on the perimeter. Leonard’s weaker profile in the postseason and limitations as an offensive engine diminish his ceiling on this list, but the totality of his championship equity ranks him near the top of the league this year.

    3. Giannis Antetokounmpo

    The Greek Freak had one of the greatest regular seasons of all-time according to the sport’s major impact metrics. Antetokounmpo led the league in RAPM, RPM, PIPM, and three BPM statistics (Basketball-Reference‘s, Backpicks‘s, and my own models). He led the league in scoring rate, 33.3 points per 75, on impressive efficiency, +5.2 relative True Shooting. The Greek Freak’s creation rates were approaching the top of the league, but similar to Kawhi Leonard, his hesitance to make tougher passes leads me to believe those figures are moderately overstated. His postseason dips aren’t close to remotely as dramatic as the average commentator will state: 31 points per 75 on +4 rTS% with similar creation rates. Antetokounmpo nearly doubled his relative offensive rebounding rate despite facing two of the league’s most prolific defensive-rebounding teams in Miami and Orlando. His absence in Game 5 of the Eastern Conference semis takes him down a notch on this list, but Antetokounmpo’s historical 2020 will remain a footnote in basketball history.

    2. Anthony Davis

    Anthony Davis makes arguably the strongest case as the league’s best frontcourt player of the season. His already elite box profile of 27 points per 75, 61 TS%, ~ 5 Box Creation, and +2.4 rORB% in the regular season leaped to 29.5, 66.5, ~ 6, and +2.9 in the postseason. Davis’s offensive profile is a great fit on strong offensive teams: strong scoring and efficiency as well as undervalued passing. Contrary to Giannis Antetokounmpo’s evaluation, Davis is a high-quality passer with lower creation rates. Davis’s shooting in the Playoffs (38% from 3) and improved play were focal points of the Lakers’ title run. However, the strongest facet of Davis’s résumé is his defense, a lethal mixture of awareness, great hands, positioning, and multidimensional coverage. His strong combo of offense and defense was good enough to blur the title of “best player” on the Lakers roster. Davis’s strong two-way play, especially in the postseason, propelled him to the second spot on this year’s list.

    1. LeBron James

    LeBron James refuses to age for another year as he contributes more championship equity than any player in the league once again. His impressive scoring repertoire as a strong driver and passable shooter, when paired with historical passing, makes James arguably the best offensive player of the year. He thrived as a primary ball-handler up top, skipping passes all over the court and converting on near-impossible chances. James’s value off the ball wasn’t as excellent, but his transferrable role as an offensive centerpiece is a strong point of his résumé. Contrary to 2019, James was a strong positive on the defensive end. His elite anticipatory movement, positioning, and rim protection contributed to a highly-valued defensive role in Los Angeles. James continued his career trend of improvement in the postseason, the deciding factor in his topping this year’s list. 


    I’ll defend my positions on these players, but there will always be some wiggle room in these rankings. The order in which the players appear on this list is not definitive, and a certain degree of shuffling wouldn’t drastically alter the results. With that, I’ll close the book on my top-10 players of 2020 player ranking. Now that we’ve cycled through another year of NBA basketball, I’m curious to read your guys’ top-10 lists. ⬇️⬇️ 


  • The Modeling and Principles of “Championship Probability Added”

    The Modeling and Principles of “Championship Probability Added”

    (? Medium)

    ForbesSports IllustratedBleacher ReportThe Washington Post, and ESPN. Five varying and mostly unrelated platforms. What do they have in common? In the past year, they’ve each taken a crack at composing a list ranking the NBA’s best active players. NBA commentators, critics, and fans are all acquainted with one or more of the aforementioned lists, each of which was followed with strong complaints. Instagram has a populous NBA community. The comment sections of related posts often feature two or more users lashing out at each other because of minor, negligible disagreements. If the league’s media has taught us anything, it’s that varying opinions can be the cause of severe conflicts, especially when it comes to ranking players.

    I’ve assembled my own lists over the years. The latest, which ranked the NBA’s top-10 players in the league, garnered strong criticism when sent to a focus group. My first and secondhand experiences with opinion-based conflicts led me to explicitly record the “methodology” of my player rankings. This article is also meant to accompany an upcoming list that ranks the top-10 players of 2020 to paint a clear and more detailed picture as to why certain players appear where they do. Based on an accumulation of theory, evaluation, and statistical modeling, here is the process that creates my player ranking lists.


    Framework

    Before composing a player ranking, I need to have an overarching ideology: a framework as to what constitutes the league’s “best” or “greatest” players. My attempt at forming a local structure to answer this question goes as follows: 1) a player is rostered with the hopes of improving the success of his/her team, a notion I believe most of us will agree on. 2) Teams possess the ultimate goal to win a championship, another notion I believe most of us will agree on. Therefore, the “best” and the “greatest” players bring teams closest to that goal: the primal ideology employed in my player-ranking lists.

    Similar criteria can be found in the CORP valuations at Backpicks, a measurement that introduced two key concepts I also use in my own rankings, the first being “portability.” Portability, also known as “scalability,” refers to how well a player’s situational value is held alongside better and better teammates. One way to think about this idea is to imagine James Harden, the recipient of the last three scoring titles, rostered alongside the likes of Giannis Antetokounmpo, Stephen Curry, Kevin Durant, LeBron James, and a heap of other NBA superstars. Would James Harden still score 30 points a night, or would his high-volume scoring be drowned out in the plethora of high-octane scorers alongside him?

    To differentiate between high and low-portability players, I’m partial to 1) a group of skills that Backpicks laid out in the site’s own post of similar nature and 2) historical observations of how a player changes from team-to-team. The following graphic serves to show the site’s definitions of skills and how they relate to scalability.

    Backpicks

    Evidently, the most “scalable” offensive skills per the legend are spacing, passing, and finishing (efficiency). Therefore, the sport’s more portable players typically display proficiency in the preceding skills. However, high-portability players aren’t exclusively defined as stated earlier. If a player shows the ability to maintain situational value on greater teams, regardless of “how,” it’s an example of high scalability. Stephen Curry is a great example relating to the former, skill-based definition of portability. He spaces the floor as well as any player in league history, displays excellence as a quality passer, and remains one of the sport’s most efficient scorers. Draymond Green is a great example relating to the latter, observation-based definition. He’s not a great spacer nor a superbly-efficient scorer, but his situational value took minor hits after the additions of multiple All-Stars to the Warriors’ roster. 

    What’s the significance of portability? It provides an optimal solution to a question of importance to me: how a player changes in different situations. As scalability was created for, a key aspect of a player’s championship equity is how that player impacts teams of varying quality. This is contrary to the conventional form of solely considering a player’s situational value, or how he impacts his single team: a single situation. My evaluations consider a player’s value on a wide range of teams, further gauging my definition of a player’s “true” value. If you were to watch the annual Thinking Basketball top-10 lists, you’d encounter the same overarching question I consider in my evaluations: which players give a random team to best odds to win a title?


    CPA Valuations

    To answer the proposed question, to determine which players provide the most championship lift across a variety of environments, I conduct player valuations at the end of a season. To gauge a player’s championship equity, I consider:

    • Film studies: random-sampling segments of a player’s games across the entirety of a season, targeting performances against varying qualities of opposing offense and defenses. This is the most useful step in understanding a player’s role on his team, information that is key for later steps.
    • Statistical profiles: quantifying a player’s actions on the court. Box scores and play-by-play data alone tell absolutely nothing about how good a player truly is, rather these profiles are an additional step in further understanding a player.
    • Impact metrics: in theory, the most important measurement tools we have. However, they only capture a player’s value on his own team; they’re measures of situational value. Comparing a player’s scores helps understand how different information (box score vs. on-off, etc.) measure s a player.
    • Numerical conversions: conforming a player’s “Regularized Adjusted Plus/Minus” (RAPM) to a neutral environment, i.e. an “average” team. That number is then plugged into a calculator that considers portability and health to estimate a player’s championship equity.

    The resulting measurement is denoted as a player’s “CPA,” or “Championship Probability Added.” Inspired by the aforementioned CORP metric, CPA measures the percent odds a player wins a title on a random team. The components of the “calculator” are based on fifty years of team data and theory to measure a player’s value. At this point in my player valuations, the fat lady starts to sing.